
Part 4: Heat Deflection Temperature vs. Dynamic Mechanical Analysis
The presentation of DMA data can sometimes frustrate users and discourage its adoption. Those unfamiliar with DMA should insist on receiving data relevant to the manner in which the part they are developing will be used.
.jpg;width=70;height=70;mode=crop;format=webp)
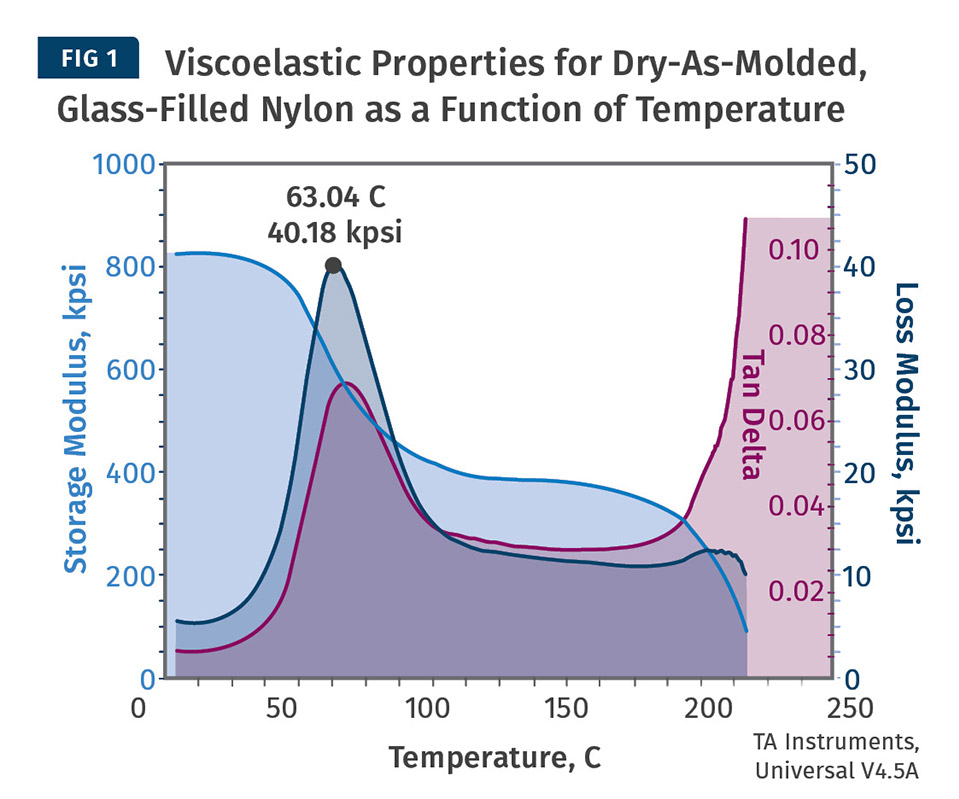
This illustrates the full scope of the output from a DMA temperature scan. Three properties are plotted. The most accessible of these to someone familiar with material properties is the storage modulus, known more formally as the elastic modulus.
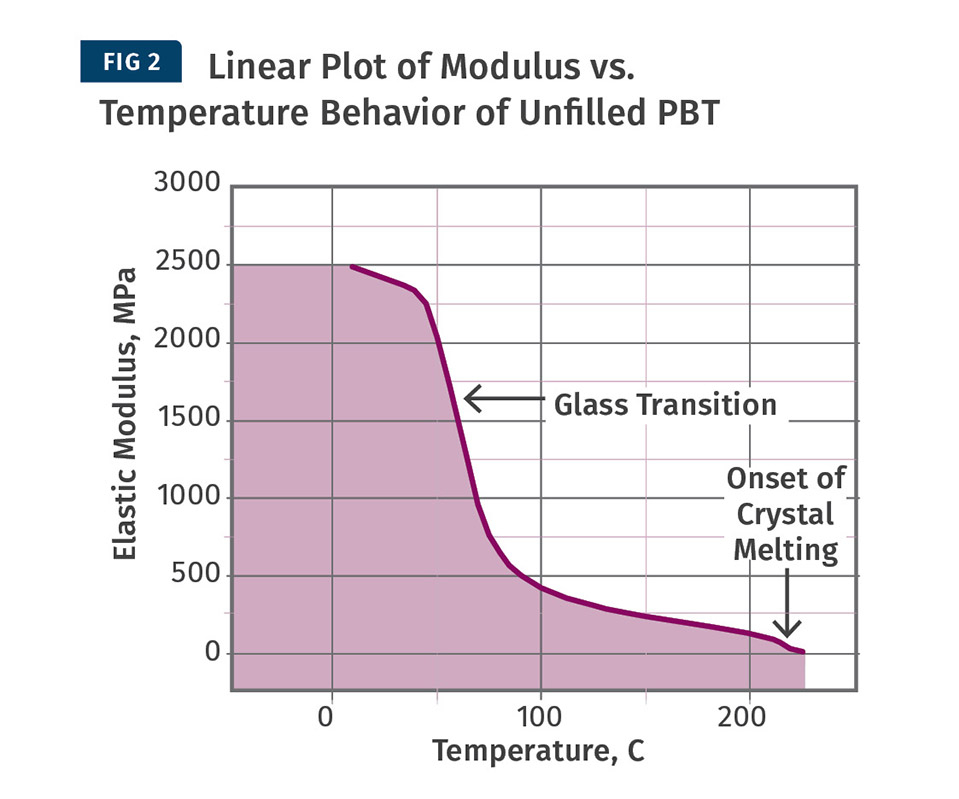
Linear plot of the elastic modulus for the unfilled PBT polyester that was discussed in Part 2 of this series, extended by 25 C to show the behavior of the material as it approaches the melting point of the polymer.
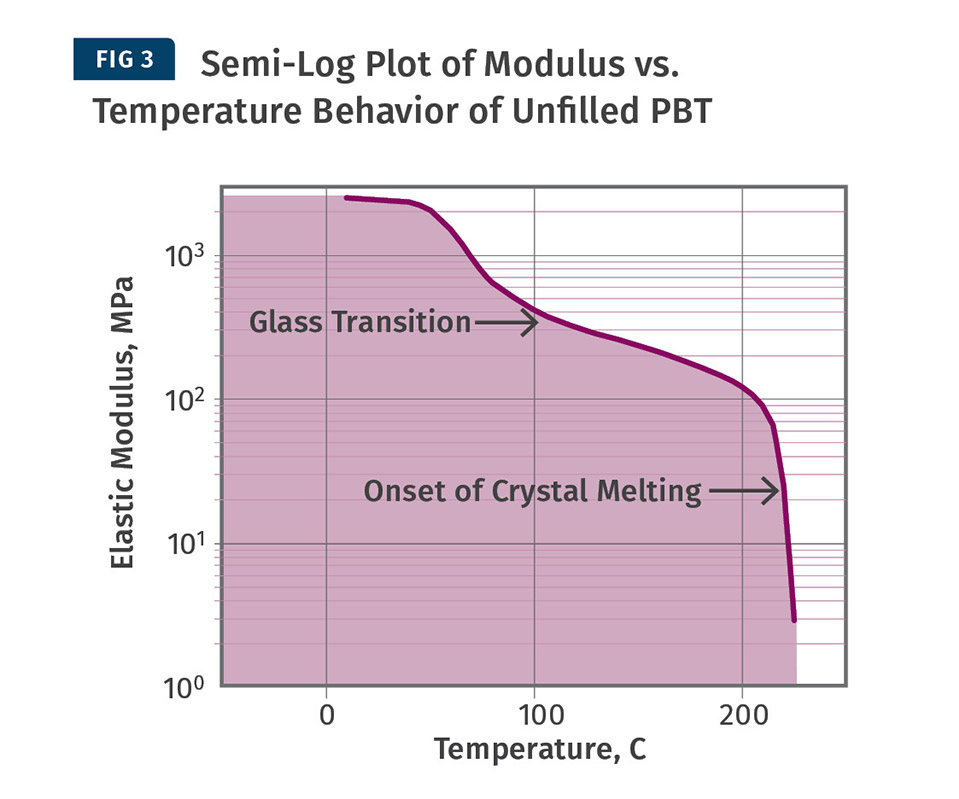
The same data as Fig. 2, with the modulus plotted on a logarithmic scale. Here, the melting process takes center stage and the glass transition, which involves the very large change in modulus that caused so many headaches for my client, is barely noticeable.


Having frequently recommended that engineers designing new products access DMA data, it is discouraging when they come back somewhat bewildered about what they obtain from either a material supplier or a third-party database. There are often problems with the way the data is presented, and it can take some navigating before the full value of the data becomes evident. (See also Parts 1, 2, 3 of this series in January, February, March issues.)
To fully explain this, it is best to begin with an illustration of the full scope of the output from a DMA temperature scan. This is shown in Fig. 1 and represents results for a glass-fiber reinforced nylon 6. Three properties are plotted. The most accessible of these to someone familiar with material properties is the storage modulus, known more formally as the elastic modulus. This is often confused with Young’s modulus because another designation for Young’s modulus is the modulus of elasticity. But Young’s modulus is a measure of stiffness calculated by measuring the change in the length of a sample when it is placed under a uniaxial stress, either in tension or compression. This concept was developed long before polymers were known and it was used to characterize the properties of metals, where the relationship between stress and strain is linear for a significant portion of the stress-strain curve.


While Young’s modulus may be a useful description for metals and other materials that primarily exhibit linear behavior under stress, plastics are notoriously non-linear once a strain of 0.25-0.5% is exceeded. And even in the so-called linear zone, non-linear aspects of the material behavior are present, though they may be hidden. Deformation within the elastic region is supposed to be completely recoverable. But in plastics, even if the stress is kept within the linear range, an increase in strain known as creep or cold flow will be observed if the stress is maintained over a sufficient period of time. Creep is essentially a very slow rate of viscous flow and it is this viscous response that produces the non-linearity.
Fundamentally, plastics are viscoelastic; they behave both like a mixture of an elastic solid and a viscous fluid. The elastic aspect provides strength, stiffness, and the ability of a material to recover from an applied stress that deforms the material. The viscous aspect gives us properties such as ductility and vibration damping. To really understand the behavior of a material, it is necessary to quantify the contribution of both sorts of behavior. DMA accomplishes this by separating the modulus that we traditionally measure into its elastic and viscous components. The modulus that begins just above 800 ksi near room temperature represents that elastic component. The viscous aspect of the material behavior is captured by the curve labeled as the loss modulus, known more formally as the viscous modulus. The third curve, designated as tan delta, is the ratio of the viscous modulus divided by the elastic modulus.
An examination of the graph in Fig. 1 shows that these three properties cover very different ranges. The elastic modulus varies from about 100 to 800 ksi and is scaled from 0 to 1000 ksi. The viscous modulus ranges across values from about 5 to 40 ksi and is scaled from 0 to 50 ksi. Tan delta barely rises above 0.10. One of the biggest problems with the presentation of these results is that the publishers sometimes use one scale for all three properties. This is adequate for presenting the elastic modulus, but the other two properties appear as flat lines devoid of any distinguishing features such as the peaks that are associated with the glass-transition temperature.
A second problem is the tendency to plot the data on a logarithmic scale as opposed to a linear scale. This bias comes from the historical treatment of DMA as a research and development tool used primarily by practitioners who are comfortable with log plots. There are times when logarithmic presentations are useful, such as with viscosity versus shear-rate curves. And if a particular change that spans several orders of magnitude must be captured, a log presentation gives some much-needed clarity. But in most cases, at least with semi-rigid and rigid materials, log plots add no such clarity, they make it more difficult to locate a specific value on the curve, and they frequently reduce the visual impact of a significant transition in properties.
Figure 2 shows the linear plot of the elastic modulus for the unfilled PBT polyester that was discussed in Part 2 of this series, but it has been extended by 25° C to show the behavior of the material as it approaches the melting point of the polymer. This addition is barely noticeable when plotted in this manner because by the time the material reaches this temperature range, it has lost over 95% of its room-temperature stiffness and the last stages leading up to crystal melting play a minor role in the grand scheme of things.
Figure 3 gives the same data with the modulus plotted on a logarithmic scale. With this presentation, the melting process takes center stage and the glass transition, which involves the very large change in modulus that caused so many headaches for my client in Part 2, is barely noticeable. It looks like a non-event because of the scaling.
A third problem involves the type of modulus that is measured. The elastic modulus that is plotted in Figs. 2 and 3 is referred to as Eʹ (or tensile storage modulus) and at room temperature it is in good agreement with the datasheet values for tensile modulus or flexural modulus. A properly calibrated DMA instrument operated in the appropriate mode should provide a value for Eʹ that agrees closely with the value that would be obtained for a modulus measured in tension or in flexure. But frequently, the value provided by DMA in the databases is the elastic modulus in shear, designated Gʹ. This is due to the fact that the early DMA instruments operated in torsion and therefore shear modulus was the property being measured. In fact, in the very early days of DMA the technique was referred to as torsional braid analysis (TBA) and plots were routinely given in Gʹ, Gʹʹ, and tan delta, all plotted logarithmically.
But in most applications, tensile modulus values are more appropriate for describing the load cases associated with an application. Tensile modulus and shear modulus are related by a relatively simple equation where the only other variable is Poisson’s ratio. For most polymers and elastomers, Poisson’s ratio falls between 0.3 and 0.45, so the value for shear modulus will be approximately 35-40% of the value for tensile modulus. So, an engineer unfamiliar with the intricacies of DMA instrumentation and convention will be provided with a graph that significantly understates the real stiffness of the material being evaluated. As an example, the unfilled PBT we have been discussing will have an elastic shear modulus of only 875 MPa (127 kpsi), vs. the elastic tensile modulus of 2415 MPa (350 kpsi).
While these obstacles are all relatively minor annoyances, they discourage the adoption of a far superior approach to evaluating material properties as a function of temperature. It takes time to become accustomed to a new way of doing things, and when that new method does not immediately produce good results, the tendency is to go back to doing something comfortable even when it isn’t working. Just ask any golfer. For best results, those unfamiliar with DMA should insist on receiving data that is relevant to the manner in which the part they are developing will be used, and they should obtain a table of values that they can then plot themselves so that they can become comfortable with what the data is telling them.
Even though having a plot of modulus vs. temperature is already a huge step beyond HDT, as Fig. 1 shows, DMA provides much more. In our next and last installment of this series we will give a brief introduction to the additional features that DMA provides.
ABOUT THE AUTHOR: Mike Sepe is an independent, global materials and processing consultant whose company, Michael P. Sepe, LLC, is based in Sedona, Ariz. He has more than 40 years of experience in the plastics industry and assists clients with material selection, designing for manufacturability, process optimization, troubleshooting, and failure analysis. Contact: (928) 203-0408 • mike@thematerialanalyst.com.


Related Content

How Inline Vision Inspection Can Minimize Scrap in Molding
Once viewed by injection and blow molders as a necessary evil, machine vision technology today can continuously monitor and improve production while reducing costs.
Read More
How to Improve Quality with Offline Inspection and Analysis
Automated sample testing with a light table detects the smallest contamination in flakes, micro granulates and sample test sheets.
Read More
Handheld NIR Instrument Distinguishes PET from PETG
Mobile spectroscopy from trinamiX detects more than 30 different plastics—and now PET vs. PETG as an aid to recycling.
Read More
Tracing the History of Polymeric Materials -- Part 30: Polyurethane
In the world of polymers, polyurethane chemistry is probably the most versatile. This a resulted in a wide range of products made from these materials and given the industry the flexibility to respond to the progressive march of regulatory concerns.
Read MoreRead Next

Lead the Conversation, Change the Conversation
Coverage of single-use plastics can be both misleading and demoralizing. Here are 10 tips for changing the perception of the plastics industry at your company and in your community.
Read More
People 4.0 – How to Get Buy-In from Your Staff for Industry 4.0 Systems
Implementing a production monitoring system as the foundation of a ‘smart factory’ is about integrating people with new technology as much as it is about integrating machines and computers. Here are tips from a company that has gone through the process.
Read More
Making the Circular Economy a Reality
Driven by brand owner demands and new worldwide legislation, the entire supply chain is working toward the shift to circularity, with some evidence the circular economy has already begun.
Read More