Materials: Cycle Time: Science vs. Rules of Thumb—Part 5
Let’s examine the behavior of semi-crystalline materials that never reach their glass-transition temperature as they cool.
In my column last month, I reviewed the way semi-crystalline polymers develop their properties as they cool, using the technique of dynamic mechanical analysis (DMA). But I limited the treatment to a material with a glass-transition temperature (Tg) above room temperature. Here, let’s examine the behavior of semi-crystalline materials that never reach their Tg as they cool, and therefore do not go through the large step change in modulus associated with this event. Three very important material classes fall into this category: PE, PP, and POM, also referred to as acetal.
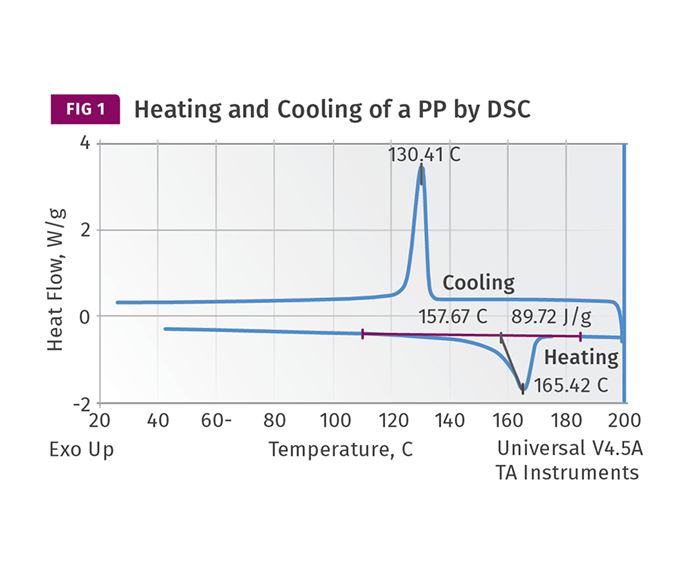
Last month I showed analytical results that illustrate how a nylon 6 crystallizes as it cools. These types of results, generated by a technique known as differential scanning calorimetry (DSC), are used as data inputs by the simulation software that seeks to predict cycle time. Figure 1 shows this same DSC cooling curve for a PP. This particular grade of PP is highly nucleated, as indicated by the peak recrystallization temperature above 130 C (266 F). This peak temperature can vary by as much as 30° C (54° F) across different grades of PP, but it will rarely exceed the value shown here.
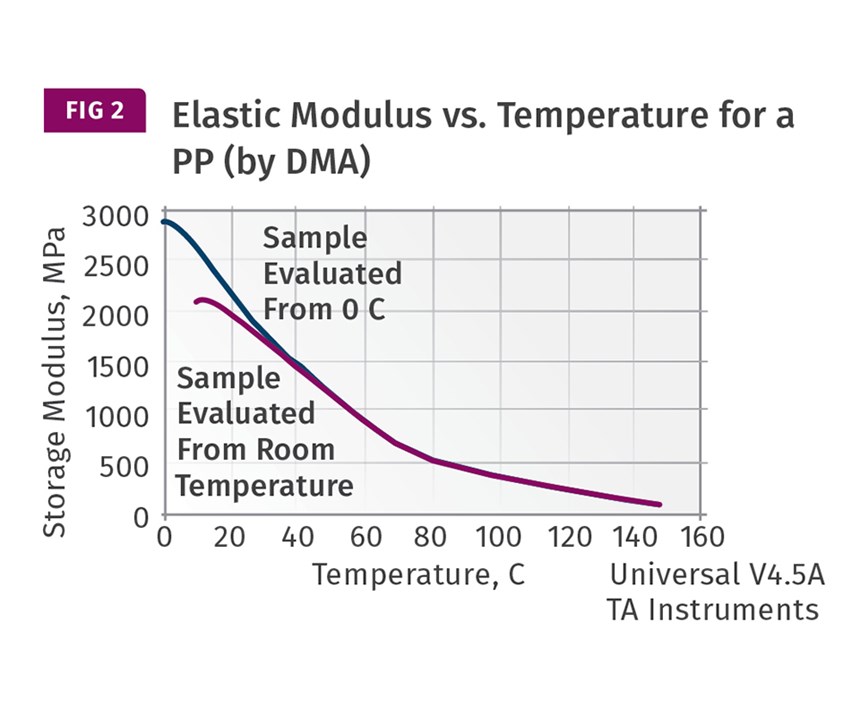
It’s generally assumed that once the temperature reaches the baseline to the left of the recrystallization exotherm, the material has solidified and can be ejected. For this material, this occurs at approximately 120 C (248 F). But an examination of a DMA curve providing the relationship between modulus and temperature shows that it is not this simple. Figure 2 shows this behavior. At 120 C this material has a modulus of approximately 200 MPa (29 kpsi). At room temperature it will reach a value 10 times greater. The development of the modulus in this PP, and in all PPs, is gradual and the actual temperature at which ejection can take place is therefore somewhat uncertain. If we were to fall back on the original guideline that started this discussion, the heat deflection temperature, we would find that the published value is 88 C (190 F) when tested at 66 psi (0.455 MPa) under the ASTM method. But the ISO technique gives a value of 79 C (174 F). And if the test is performed at 264 psi (1.8 MPa) the result is 50 C (122 F). Which one do we use?
Want to learn more about Materials? Visit the Materials Know How Zone
If we fall back on the rule of thumb that the part can be ejected at 80% of the HDT, where does that leave us? If we select 50 C and ignore the importance of using the absolute temperature (Kelvin) scale we get an answer of 40 C (104 F). To those who have been molding PP parts for a while, this probably looks like a reasonable number. Of course, if we treat temperature the way all the other sciences do and use the absolute scale, we end up with a value well below room temperature. (I will let you work out the math for yourself). The question becomes, how can an ejectable temperature be determined if there are no data in the simulation software (or the back-of-the napkin calculation) that relate the stiffness of the material to temperature?
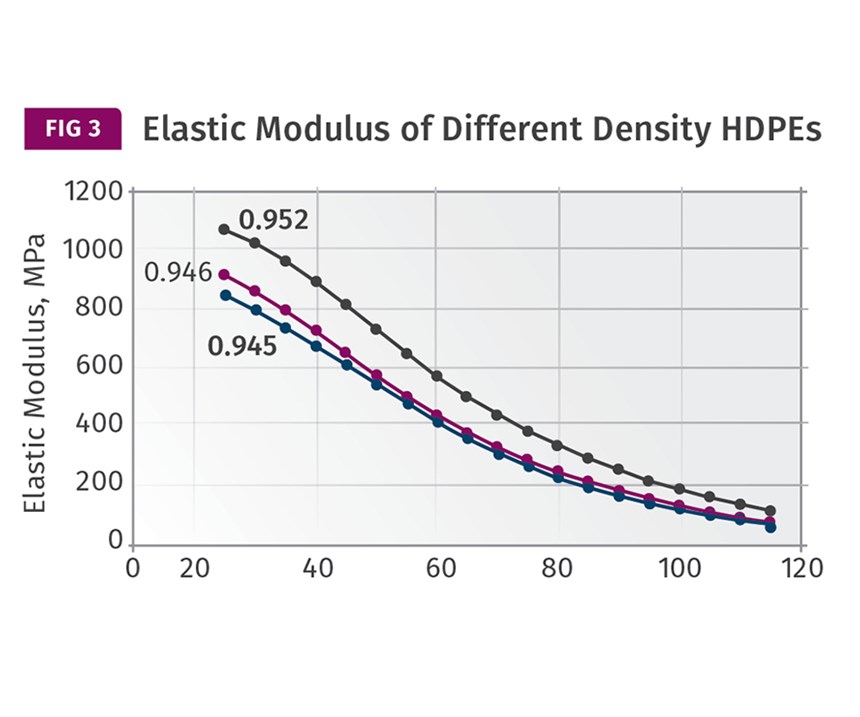
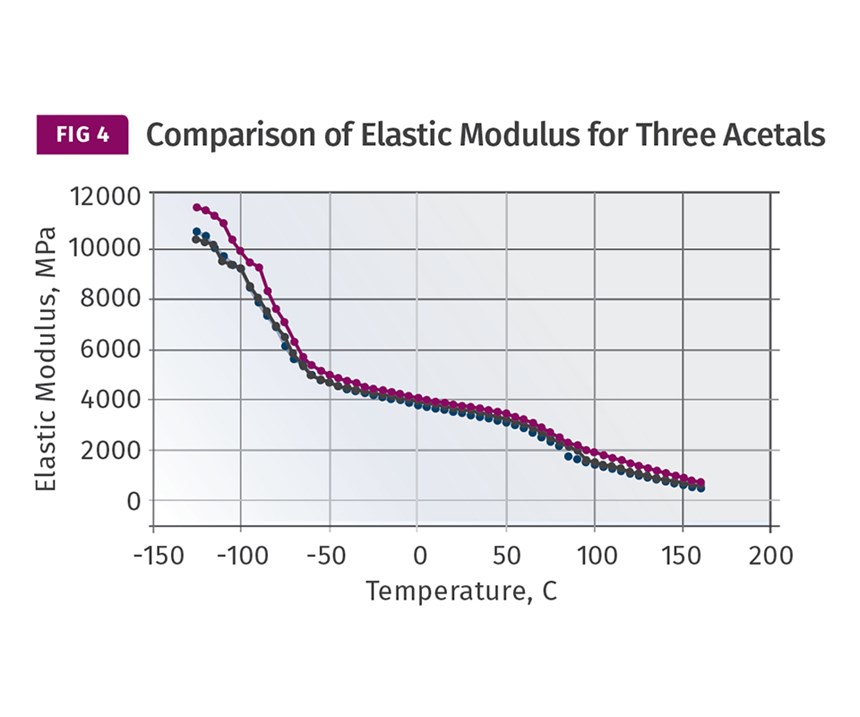
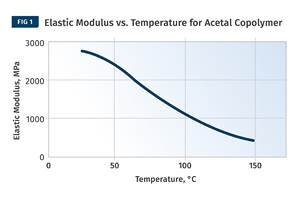
The good news is that all three of these material families—PE, PP, and POM—follow the same general relationship between modulus and temperature in the region between ambient conditions and the onset of crystal melting. The behavior can be approximately captured as two different slopes, and within each segment the trend is nearly linear. Figure 3 shows modulus vs. temperature plots for three different HDPEs and Fig. 4 shows the same data for three different POM copolymers. Note that in this last graph the glass transition is shown with the accompanying rapid change in modulus. But it occurs at -75 C (-103 F), a temperature we will never see on the floor of a molding plant.
The lack of a well-defined plateau in these materials, such as we saw in the nylon, makes prediction of cycle time far trickier. In addition, these three families have higher degrees of crystallinity than other semi-crystalline polymers.
This means that as they crystallize they release a significant amount of energy into the system as heat. This represents an additional thermal load above and beyond the requirement to simply lower the temperature of the material. This additional heat must be carried away by the cooling circuitry in the tool and will slow the development of modulus in the initial stages of solidification.
If you find this concept difficult, try hooking up a thermocouple to a mold near the cavity. Set the water temperature and start making parts in an amorphous material like polystyrene. You will observe a small temperature rise as the material enters the mold for each shot. The temperature will typically return to its original point by the time the part is ejected. Then change to a PP or a PE but do not alter the melt temperature. You will observe a much larger temperature rise as the semi-crystalline material fills the tool. This is caused by the heat release associated with crystallization that is illustrated by the DSC curve in Fig. 1.
Before we leave this discussion, there is one more class of materials that we need to address—elastomers. Materials like TPEs, TPUs, and flexible PVC are all meant to function above their Tg and many of these materials develop very little stiffness at and above room temperature. Consequently, we cannot measure a heat deflection temperature that can be used to fulfill our rule of thumb. If we did measure this property, we would find that it would be below room temperature, given the way we define HDT today. And yet we make parts from these materials every day without using cryogenic conditions in our molds. How can this happen? We will consider this in our next article.
ABOUT THE AUTHOR: Mike Sepe is an independent, global materials and processing consultant whose company, Michael P. Sepe, LLC, is based in Sedona, Ariz. He has more than 40 years of experience in the plastics industry and assists clients with material selection, designing for manufacturability, process optimization, troubleshooting, and failure analysis. Contact: (928) 203-0408 • mike@thematerialanalyst.com.
Related Content
Where and How to Vent Injection Molds: Part 3
Questioning several “rules of thumb” about venting injection molds.
Read MoreThe Effects of Time on Polymers
Last month we briefly discussed the influence of temperature on the mechanical properties of polymers and reviewed some of the structural considerations that govern these effects.
Read MoreThe Importance of Barrel Heat and Melt Temperature
Barrel temperature may impact melting in the case of very small extruders running very slowly. Otherwise, melting is mainly the result of shear heating of the polymer.
Read MoreThe Fundamentals of Polyethylene – Part 2: Density and Molecular Weight
PE properties can be adjusted either by changing the molecular weight or by altering the density. While this increases the possible combinations of properties, it also requires that the specification for the material be precise.
Read MoreRead Next
Cycle Time: Science vs. Rules of Thumb—Part 4
While laboratory tests are helpful in determining how polymers behave, you must remember the fundamental differences between laboratory measurements and the real world of plastic processing. Let’s examine semi-crystalline polymers here.
Read MoreSee Recyclers Close the Loop on Trade Show Production Scrap at NPE2024
A collaboration between show organizer PLASTICS, recycler CPR and size reduction experts WEIMA and Conair recovered and recycled all production scrap at NPE2024.
Read MoreFor PLASTICS' CEO Seaholm, NPE to Shine Light on Sustainability Successes
With advocacy, communication and sustainability as three main pillars, Seaholm leads a trade association to NPE that ‘is more active today than we have ever been.’
Read More
.jpg;width=70;height=70;mode=crop)
