MATERIALS: The Problems with Single-Point Data, Part 8
DTUL tests may have made sense in the 1940s and 1950s, before the advent of dynamic mechanical analysis. But designers and engineers today need better tools.
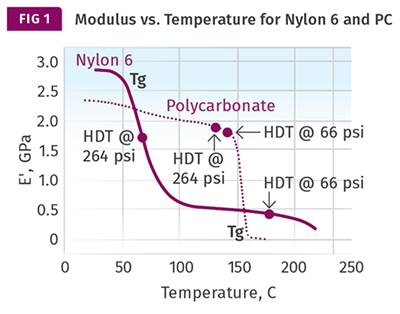
As we noted in last month’s column, as astute as Dr. Michael Takemori’s analysis was in his 1978 SPE ANTEC paper, the modulus values he calculated that should be associated with the stress levels specified in the DTUL test do not usually agree with the values related to the temperatures we find on the data sheets. Generally, the actual DTUL values occur at temperatures lower than those associated with the benchmark modulus values. To put it another way, the measured modulus of the material at the DTUL is higher than Takemori’s calculated values.
There is an important reason for this and Takemori did address it in his paper. However, the brevity of ANTEC papers prevented him from delving into the discussion in great detail. Here is an extended version of the discussion he started.
During a DTUL test, the specimen is under constant stress. Depending upon the polymer being tested, DTUL tests can last anywhere from 30 minutes to nearly three hours. A polymer under constant stress undergoes creep; whatever deflection the sample exhibits at the moment the stress is first applied will increase over time, even if we do not heat the sample. Given enough time, the sample deflection that represents failure as defined by the DTUL test will be attained without the application of increased temperature.
In other words, there is a creep component to the DTUL test. The initial deflection is a function of the modulus of the material. The subsequent deflection is the result of the combined influence of increasing temperature and the effect of sustained loading. It is not possible to readily determine the relative influence of these two factors in the outcome of the test. For very creep-resistant materials, such as a highly filled nylon or polyetherimide, we can expect that temperature will be the primary contributor to the test result.
But for a material like polyethylene or polypropylene, the time-dependent behavior of the material can be expected to play a much larger role. The implication of the DTUL protocol is that the sample deflection is due solely to the increase in the temperature of the sample. But it can be easily demonstrated that if the stress were applied and the apparatus remained at room temperature, eventually the deflection associated with failure would occur and we would be faced with reporting that the deflection temperature was room temperature.
This is exactly what would happen immediately in most unfilled compounds if they were tested using the higher load that the ISO method designates as Method C. Recall that using Takemori’s calculation approach, the modulus associated with a stress of 8 MPa (1160 psi) is approximately 3520 MPa (510.4 ksi). Very few unfilled thermoplastics have a modulus this high at room temperature. If we applied this stress to an unfilled polycarbonate, for example, the sample would immediately deflect far enough to fail. In order to obtain an accurate result at this stress level it would be necessary to cool the sample until it became rigid enough to exceed this benchmark value. Then we could begin to heat the sample until it deflected enough to fail. The result would be a value below room temperature. Would we still refer to it as a “heat” deflection temperature?
Even at the lower stresses more commonly used, soft flexible materials like plastomers, elastomers, and many fluoropolymers exhibit this type of behavior. This is why for many of these materials no DTUL values are provided; they would provide no guidance on the maximum temperature at which these materials can be used. For example, A TPE that might be useful at 120 C (248 F) would report a DTUL of room temperature (or even lower). PTFE, a material known to be serviceable at temperatures as high as 230 C (446 F), has a DTUL of approximately 55 C (131 F) simply because it loses a significant amount of stiffness at a relatively low temperature.
And yet we are asked to believe that material selection is simply a matter of establishing a requirement for a property such as DTUL, and then plugging that value into a database that will then provide us with a list of candidate materials. Let us suppose that we follow this approach and we decide that the magic number that our application requires is 200 C (392 F). The list of materials that can function for any significant length of time at 200 C is a relatively short one because we are not only concerned with the short-term response captured by the DTUL test.
We also must be aware of time-dependent behavior under load (creep or stress relaxation), the increased susceptibility to chemical attack that comes with elevated temperatures, and the progressive effects of oxidation. But because the DTUL test is a short-term evaluation, none of these other effects will be considered and the list of candidates will be a long one. It will include many filled grades of nylon 46, nylon 66, partially aromatic polyamides (PPA), PBT and PET polyesters, polyphenylene sulfide (PPS), and both filled and unfilled polyetherimides (PEI), polyethersulfones (PES), polyphenylsulfones (PPSU), and polyamide-imides (PAI).
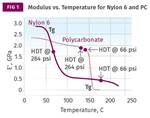
Figure 1 shows a comparison of elastic modulus as a function of temperature for two materials from this list. One is a 30% glass-fiber reinforced PBT polyester and the other is a polyetherimide with the same 30% glass-fiber loading. The listed DTUL values for these two grades are both above 200 C and differ by only 3° C. However, the modulus curves show that these two materials are not the same at all, and across a very wide temperature range they can be expected to exhibit very different performance characteristics as both a function of temperature and time. It is also interesting to note that while the DTUL values for these two materials coincide with a modulus somewhat higher than the values in Takemori’s paper, the two curves nearly intersect at 225 C (437 F), where the modulus is almost exactly equal to Takemori’s calculated value.
Figure 1 also illustrates the rationale for introducing Method C in the ISO version of the DTUL test. The stress level associated with Method A gives the impression of equivalence because the DTUL of a reinforced semicrystalline polymer is near its melting point, while the DTUL of a reinforced amorphous polymer is near its glass transition. For these two polymers, these respective events occur at approximately the same temperature. The higher stress used in Method C raises the bar, so to speak, associating the DTUL with a modulus closer to that of the glass-transition temperature for the PBT and placing a large gap between the two measurements.
While this may appear useful, it is the worst kind of incrementalism. It represents an attempt to maintain the utility of a method that has long since outlived its worth. DTUL tests may have made sense in the 1940s and 1950s, before the advent of dynamic mechanical analysis (DMA). But DMA has been around for more than 50 years and user-friendly instruments have been with us for nearly 30 years. It is time for some innovation. It is also time for the industry to get serious about providing engineers and designers with the tools they need to make informed decisions about the performance of plastic materials under the varied conditions at which they are being used in today’s markets. Next month we will demonstrate how this enhanced picture of temperature-dependent behavior can be extended to understand time-dependent behavior.
ABOUT THE AUTHOR
Related Content
Why Shoulder Bolts Are Too Important to Ignore (Part 1)
These humble but essential fasteners used in injection molds are known by various names and used for a number of purposes.
Read MoreImproving Twin-Screw Compounding of Reinforced Polyolefins
Compounders face a number of processing challenges when incorporating a high loading of low-bulk-density mineral filler into polyolefins. Here are some possible solutions.
Read MoreFundamentals of Polyethylene – Part 6: PE Performance
Don’t assume you know everything there is to know about PE because it’s been around so long. Here is yet another example of how the performance of PE is influenced by molecular weight and density.
Read MoreWhere and How to Vent Injection Molds: Part 3
Questioning several “rules of thumb” about venting injection molds.
Read MoreRead Next
MATERIALS: The Problems with Single-Point Data, Part 7
The industry can choose between continuing to perform DTUL tests that provide single points that are part of a curve never seen, or perform the test that provides the entire curve.
Read MoreRendimiento de los polímeros: problemas con datos a una sola temperatura
En una hoja de datos, las propiedades de los polímeros se dan generalmente a una sola temperatura. Pero ¿se mantienen esas propiedades cuando se cambian las temperaturas? Por supuesto que no.
Read MoreMATERIALS: Impact Testing: The Problems With Single-Point Data
Knowledge of test conditions and graphical data showing the course of the impact event can help provide engineers and designers with the information they need to make informed choices about material toughness.
Read More
.jpg;width=70;height=70;mode=crop)
