MATERIALS: The Trouble with Data Sheets
Data sheets are routinely relied upon, yet the data they provide is limited in scope and can lead to incorrect conclusions.
For better or worse, most of the information the industry uses to make decisions regarding material performance are based on the properties published on the data sheet. There are a lot of reasons to be concerned about this. First and foremost, the mechanical properties provided on the data sheets are almost always measured at a single temperature, 23 C (73 F).
Most of us know that the properties of plastics change with temperature, even if we are bit hazy on the specifics. And we routinely develop applications using these materials where the temperature will vary from 23 C. Yet we seem to be content with obtaining properties at one temperature and guessing about what will happen as temperatures fluctuate above and below this point.
But even if we assume that the limited view of material behavior that the data sheets provide is sufficient, there is a second problem that usually goes unnoticed: Often the properties are not generated under equivalent test conditions, and this change in conditions alters the numbers. This problem has become more acute with the advent of ISO as an intended global standard because the ISO methods and even the sample geometry differ from those used by more regional approaches such as ASTM, DIN, and JIS. Many data sheets now publish the same property measured using different standards and frequently the numbers do not agree with each other.
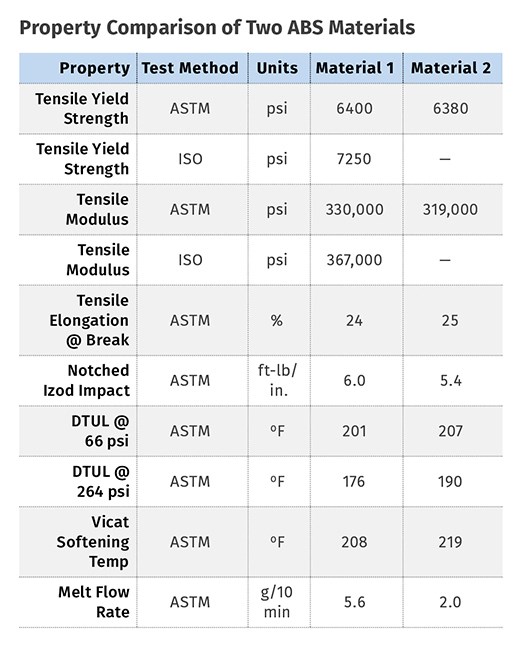
Even before the efforts at global harmonization started, there was always the problem of different material suppliers using different methods to characterize their materials. The table below gives some properties for two general-purpose ABS materials as an example of this. The properties shown here are the ones that tend to be the focus of most comparisons.
The first thing that is notable is the difference in the yield strength and modulus of Material 1 when evaluated using the corresponding ASTM and ISO test methods. In both cases, the values are higher using the ISO approach. The tensile strength is nearly 14% higher and the tensile modulus is 11% higher—not exactly trivial differences.
If we simply compare the ASTM-derived values for the two materials, we get the general impression of equivalence, except when it comes to the melt flow rate. That is, until we start reading the fine print related to how the tests were performed. The crosshead speed used for Material 1 is 0.2 in./min while for Material 2 it is 2 in./min.
Both of these speeds are allowed under ASTM D 638; however, there are guidelines in the method dictating which one is appropriate, and in this case the correct speed is the slower one.
But why should we care? Well, as it turns out, the properties of plastic materials vary with strain rate; and the higher the strain rate, the higher the yield strength and modulus will be. The general rule for amorphous materials like ABS is that for each order of magnitude increase in crosshead speed, these values will increase by 7%. So while the numbers in the table make the two materials look similar, Material 1 is actually stronger and stiffer.
By the same token, a faster crosshead speed reduces elongation at break. This property is a useful measurement of practical toughness; higher elongation values are associated with more ductile materials. So while the values for this property again give the impression of equivalence, if the materials had been evaluated at the same crosshead speed, Material 2 would have exhibited a higher elongation at break.
Note that this is contradicted by the notched Izod impact values, which show an 11% higher value for Material 1. This does not necessarily make either comparison wrong. It is simply looking at a different point on the property spectrum. Tensile tests are performed at a relatively slow rate and can take anywhere from 10 seconds to five minutes from start to finish. Impact tests are completed in a matter of milliseconds. In addition, tensile specimens do not contain a notch, which acts as a stress concentrator that alters the behavior of the material.
The deflection temperature under load (DTUL) and Vicat softening values also contain some inconsistencies that make comparisons challenging. The values appear to be higher for Material 2. However, a close look at the specifics of the sample geometry again show that things are not necessarily as they appear. The DTUL specimens used for Material 1 are 0.126 in. thick while the specimens used for Material 2 are twice as thick. This thicker wall will naturally increase the measured DTUL. We cannot be sure if this will account for the entire difference, but we can be sure that the upper temperature limit that DTUL is supposed to represent is not as different between the two materials as the numbers would suggest.
The Vicat softening numbers also have a problem. There are multiple heating rates and multiple loads allowed by this test, and these will influence the results. A faster heating rate will increase the measured value while a higher load will decrease it. In this case, both material suppliers used the same heating rate. However, the manufacturer of Material 1 used a load of 50 Newtons (N, equivalent to 0.225 lbf), while the supplier of Material 2 used 10 N. So here again, the higher Vicat softening point for Material 2 may simply be an artifact of the lighter load.
Finally, we have the melt flow rate (MFR). Most molders use this as a gauge of how a material will flow when it is processed. We have written extensively in past issues regarding why this is not accurate. However, given the fact that this is a widely held belief, we can assume that those processors who place a lot of focus on this number will have some strong opinions about which material will process more easily. A quick look at the values suggests that Material 1 will flow more easily.
But here again, the comparison is not valid because the test methods are different. Material 1 is tested at 230 C with a constant load of 3.8 kg while Material 2 is tested at 200 C with a constant load of 5 kg. The higher test temperature coupled with the lighter load will increase the flow rate by a factor of approximately 3 to 3.5. Therefore, if Material 2 was tested in the same way as Material 1 the MFR would be about 6-7 g/10 min.
There are a lot of reasons to look for information that goes beyond the realm of what the data sheet can provide. In the next few articles we will elaborate on these reasons. But even if we were to assume that providing single-point data was sufficient, we need to understand the pitfalls associated with non-standard approaches to testing, even when standards supposedly exist.
Related Content
Medical Tubing: Use Simulation to Troubleshoot, Optimize Processing & Dies
Extrusion simulations can be useful in anticipating issues and running “what-if” scenarios to size extruders and design dies for extrusion projects. It should be used at early stages of any project to avoid trial and error and remaking tooling.
Read MoreA Guide to Ultrasonic Welding Controls
Ultrasonic welding today is a sophisticated process that offers numerous features for precise control. Choosing from among all these options can be daunting; but this guide will help you make sense of your control features so you can approach your next welding project with the confidence of getting good results.
Read MoreUltrasonic Welding: Tips, Techniques, and Troubleshooting
In this collection of content, we provide expert advice on welding from some of the leading authorities in the field, with tips on such matters as controls, as well as insights on how to solve common problems in welding.
Read MoreThe Effects of Stress on Polymers
Previously we have discussed the effects of temperature and time on the long-term behavior of polymers. Now let's take a look at stress.
Read MoreRead Next
For PLASTICS' CEO Seaholm, NPE to Shine Light on Sustainability Successes
With advocacy, communication and sustainability as three main pillars, Seaholm leads a trade association to NPE that ‘is more active today than we have ever been.’
Read MorePeople 4.0 – How to Get Buy-In from Your Staff for Industry 4.0 Systems
Implementing a production monitoring system as the foundation of a ‘smart factory’ is about integrating people with new technology as much as it is about integrating machines and computers. Here are tips from a company that has gone through the process.
Read MoreBeyond Prototypes: 8 Ways the Plastics Industry Is Using 3D Printing
Plastics processors are finding applications for 3D printing around the plant and across the supply chain. Here are 8 examples to look for at NPE2024.
Read More
.jpg;width=70;height=70;mode=crop)
