Melt Flow Rate Testing–Part 1
Though often criticized, MFR is a very good gauge of the relative average molecular weight of the polymer. Since molecular weight (MW) is the driving force behind performance in polymers, it turns out to be a very useful number.
Melt flow rate testing can be characterized as the Rodney Dangerfield of material test methods—it gets no respect. People from all parts of the industry downplay the value of the test or denigrate its usefulness outright. Those who instruct industry professionals on processing are quick to point out that the melt flow rate (MFR) value for a material is a single point on a curve that characterizes viscosity as a function of shear rate. Since plastics are non-Newtonian, their viscosity varies with shear rate.
Limitations of MFR

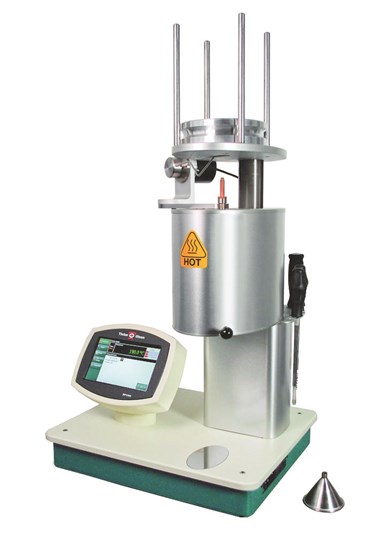
Melt indexers, or extrusion plastometers, are common lab tools used to determine the melt flow rate (MFR). The test, while often disparaged, gauges the relative average molecular weight (MW) of the polymer. Since MW is the driving force behind performance in polymers, it turns out to be a very useful number.
Photo: Tinius Olsen
The melt flow rate test moves the molten material at a single flow rate, therefore a single shear rate, and fails to capture the full range of the behavior of a material as a function of changing shear rate. To make matters worse, the shear rate is not even controlled. While the load on the material, or the shear stress, is constant during the course of the test, the shear rate is an output of the test. The MFR itself is a reflection of the shear rate used during the course of the test, but it is a result of the test and not a controlled input.
Academicians do not like the units. How do you get from grams/10 minutes to anything meaningful in terms of fundamental polymer behavior? I have written extensively on the relative relationship between MFR and average molecular weight. This has earned me occasional irate e-mails from university professors insisting that I explain how you convert from g/10 min to the proper units for molecular weight, which are grams/mole. It is a good question and one that we will answer as completely as possible over the course of these next few articles.
In fact, melt flow rate testing is a poor tool for gauging processability, for reasons that we will explain in detail later in this series. But it was never intended to be a measurement of processability; this is an interpretation that has been applied by some in the processing community. The notion that a melt flow rate tester is some type of poor man’s capillary rheometer is fundamentally incorrect. In addition, the relationship between MFR and average molecular weight is a relative one. There are a lot of factors that can skew this relationship and make interpretation tricky.
For example, adding ingredients to a compound such as glass fibers, impact modifiers, and certain additives can alter the MFR of a material without changing the average molecular weight of the polymer one bit.
Molecular Weight
But if the test is so useless, why does the value appear on so many material data sheets? Not only is it a line item on the majority of published data sheets, it is often the key characteristic that distinguishes one grade of material from another within a given polymer family. In materials as diverse as polycarbonate, acetal, and polystyrene, the MFR may be the only value on the data sheet that varies significantly from grade to grade within a particular product offering. The reason is simple. Assuming that all other factors are kept constant, the MFR is a very good gauge of the relative average molecular weight of the polymer. Since molecular weight (MW) is the driving force behind performance in polymers, it turns out to be a very useful number.
Flow rate in a polymer is related inversely to viscosity. High-viscosity materials flow with greater resistance and therefore more slowly under any particular set of conditions than low-viscosity materials do. Therefore, higher-MW polymers have lower MFR values and lower-MW polymers have higher MFR.
Practitioners of injection molding prefer the latter because it is easier to fill demanding flow paths in a mold with what we refer to as “high-flow” materials. Extruders and blow molders are more likely to prefer higher-MW materials because they provide higher melt strength, a factor that makes it easier to control the shape of a parison or a complex profile, die-swell considerations notwithstanding. End users prefer higher-MW polymers whether they know it or not, because higher MW correlates with better product performance. Impact resistance, fatigue performance, environmental stress-crack resistance (ESCR), and barrier properties (to name a few) all improve with higher MW.
My first exposure to the importance of MW as a material-selection criterion came on the molding floor over 30 years ago. We were molding traffic-light signal housings out of a high-MW injection grade of polycarbonate. The nominal MFR of the material was 5 g/10 min. The geometry of the part, coupled with the age of our molding machines, made this a very challenging part to produce. Because the performance of the part was quite critical, we conducted a falling-dart impact test once every hour to make sure that the process was under control. At the conclusion of the run we would randomly select 20 parts from the lot and repeat the impact test. The typical result was that 20 out of 20 parts passed.
One day we decided to see what would happen if we used a lower-MW grade. The reasoning went something like this: If we can use a material that flows more easily, we can reduce the melt temperature of the material and the pressures associated with injection and packing. This will reduce the stress on the material and improve the impact performance of the part or at least compensate for the reduced impact strength of the lower-MW polymer.
When we sampled a grade with a nominal MFR of 10 g/10 min we did, in fact, observe that we could reduce the melt temperature of the material by 40° F (22° C), and our pressure during first-stage filling declined by 10%. But when we ran our impact performance evaluation on 20 parts made from this material, only four of them survived the test. This large change in behavior occurred despite the fact that the notched Izod impact values published on the data sheets for these two grades were the same. This disparity between actual performance and the expectations created by the data sheet occurs every day in our industry, and we will address the reasons for this in a later article.
In our next article we will describe the MFR test procedure and discuss some of the strengths and weaknesses of the test. We will also explain the reason why so many material suppliers use the property, not only as a published line item but also as a key parameter for quality certification from lot to lot.
ABOUT THE AUTHOR: Michael Sepe is an independent materials and processing consultant based in Sedona, Ariz., with clients throughout North America, Europe, and Asia. He has more than 45 years of experience in the plastics industry and assists clients with material selection, designing for manufacturability, process optimization, troubleshooting, and failure analysis. Contact: (928) 203-0408 • mike@thematerialanalyst.com
Related Content
In Sustainable Packaging, the Word is ‘Monomaterial’
In both flexible and rigid packaging, the trend is to replace multimaterial laminates, coextrusions and “composites” with single-material structures, usually based on PE or PP. Nonpackaging applications are following suit.
Read MoreCommodity Resin Prices Flat to Lower
Major price correction looms for PP, and lower prices are projected for PE, PS, PVC and PET.
Read MoreThe Fundamentals of Polyethylene – Part 1: The Basics
You would think we’d know all there is to know about a material that was commercialized 80 years ago. Not so for polyethylene. Let’s start by brushing up on the basics.
Read MorePolyethylene Fundamentals – Part 4: Failed HDPE Case Study
Injection molders of small fuel tanks learned the hard way that a very small difference in density — 0.6% — could make a large difference in PE stress-crack resistance.
Read MoreRead Next
Lead the Conversation, Change the Conversation
Coverage of single-use plastics can be both misleading and demoralizing. Here are 10 tips for changing the perception of the plastics industry at your company and in your community.
Read MoreFor PLASTICS' CEO Seaholm, NPE to Shine Light on Sustainability Successes
With advocacy, communication and sustainability as three main pillars, Seaholm leads a trade association to NPE that ‘is more active today than we have ever been.’
Read More
.jpg;width=70;height=70;mode=crop)


