An Inside Look at Turbulent Flow
Years of talk about observing and studying coolant flow in a clear simulated cooling channel finally becomes a reality. Here’s how it all came together, and what it all means.
There has been lots of thought, talk, lab work, and articles written about the topic of coolant flow in molds, heat transfer, turbulence, Reynolds number, and good cooling practices. Now, thanks to Burger & Brown Engineering, you can see it.
Over the years there has been lots of thought, talk, lab work, and articles written about the topic of coolant flow in molds, heat transfer, turbulence, Reynolds number, and good cooling practices. But what if you could actually observe and study coolant flow in a clear simulated cooling channel? About a year ago, Burger & Brown Engineering Inc. made that happen. This article chronicles the construction, operation, and interesting results from our clear mold.
OUR EXPERIMENTAL SETUP
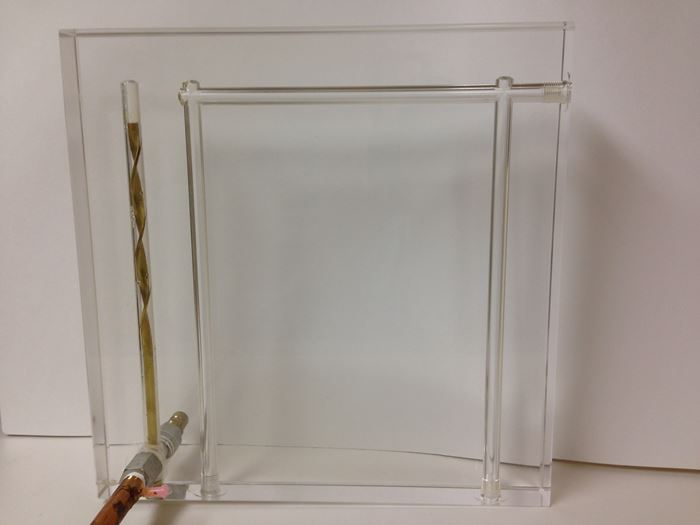
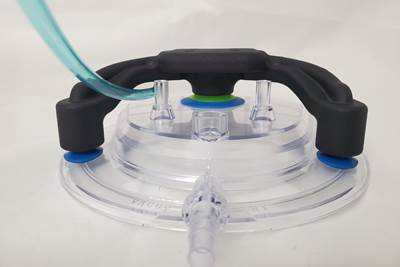
We started with a 12 in.2, 1.5-in.-thick sheet of acrylic and drilled two cooling circuits. One was a 7/16-in. diam. “U” shape and the other a 7/16-in. diam. blind circuit for experiments with baffles and bubblers. All exterior and interior surfaces were polished to be clear as glass, so we could easily observe flow patterns in the circuits.
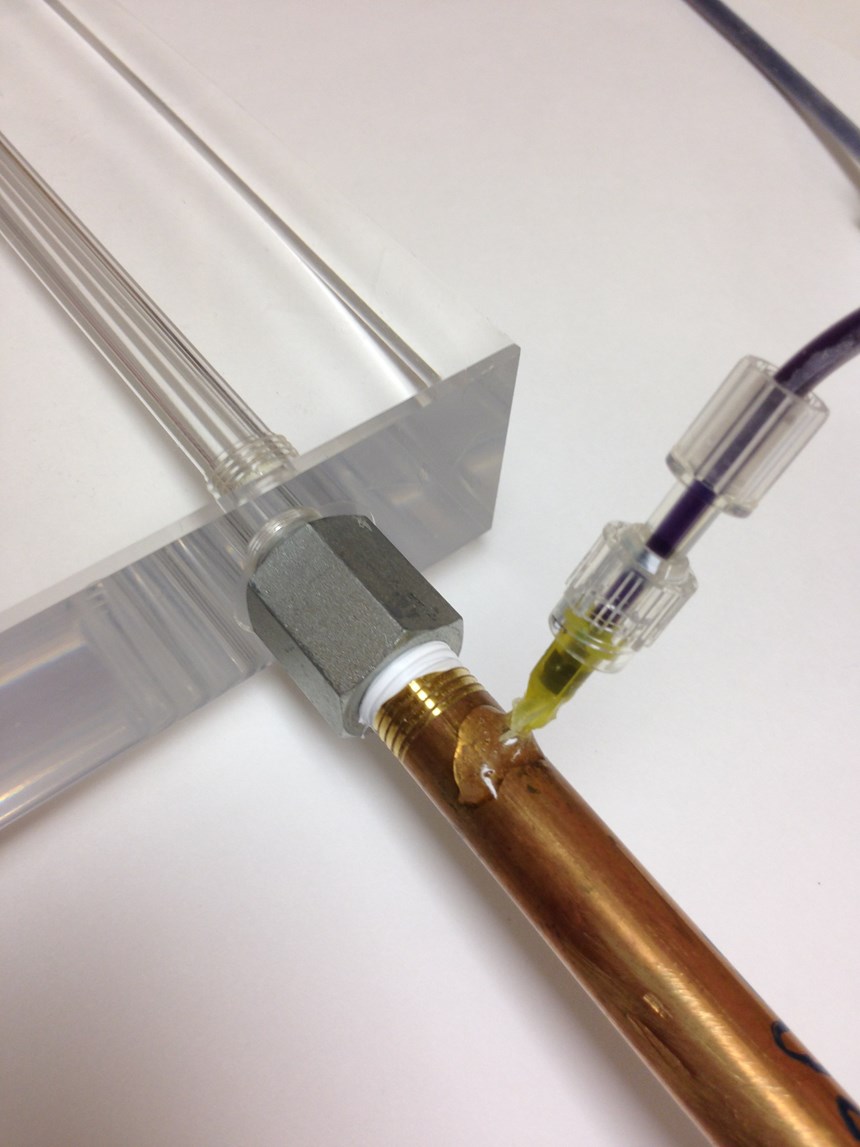
The next step was to devise a means of making the flowing water visible. A common technique in liquid flow studies is to inject a dark dye trace into the flow stream. The visible trace makes it easy to observe the flow behavior. We weren’t certain how to get the dye into the flow, but we thought we could use a tiny 90° syringe tip, commonly used for industrial dispensing of adhesives and the like. We built our first dye injection pipe from a 6-in.-long, ¼-in. NPT brass pipe nipple. We drilled a tiny hole in the side, and inserted the syringe tip through the hole, carefully positioning it to be concentric with the pipe. We epoxied the syringe tip to the pipe. The dye injection pipe could then be screwed into the mold inlet.
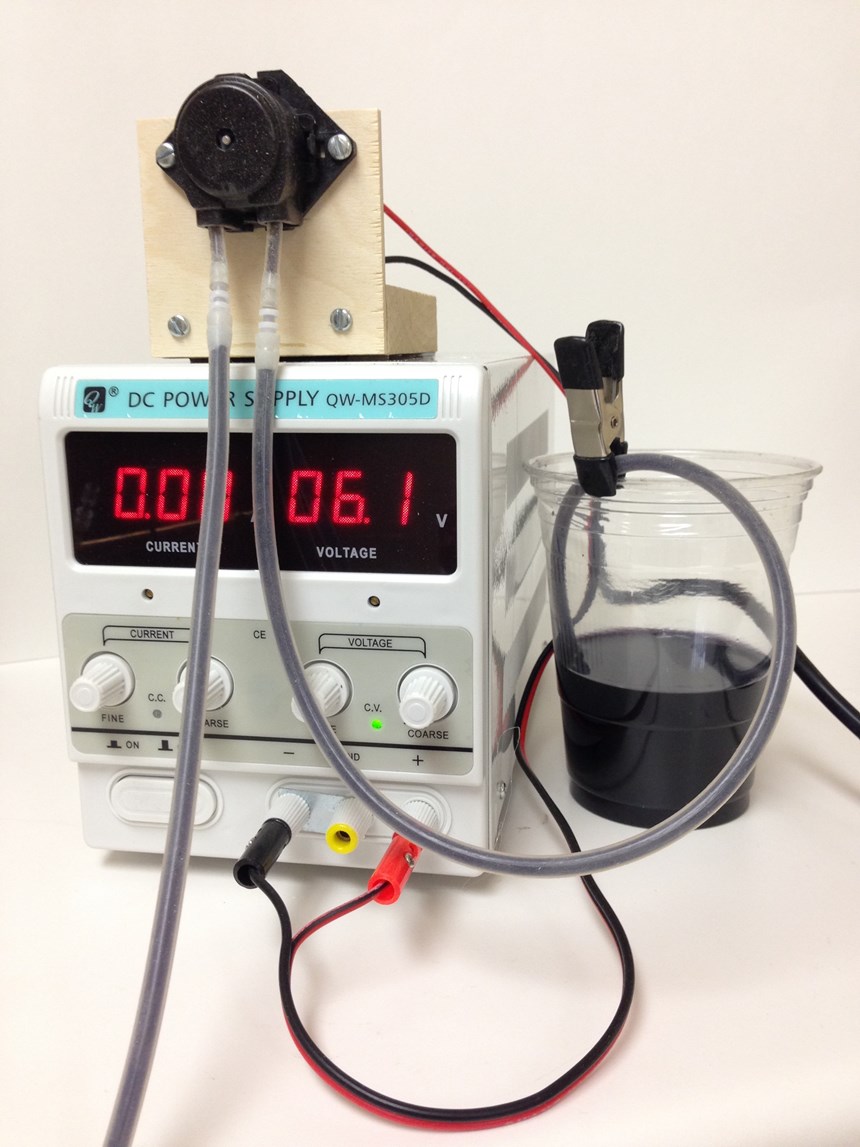
With this setup we could pump a thin stream of dye right into the center of the pipe in the direction of flow. We believed we would need to match the velocity of the dye trace to the water velocity. This meant we needed a variable-speed pump—a really tiny one! We found a miniature peristaltic pump that we could control with a variable power supply. We used diluted black ink to create the trace. Our water supply came from city water and we found it necessary to regulate the pressure down to about 15 psi to prevent water from backing up into the dye-pumping system. We controlled the water flow rate with a precision flow regulator. We were now ready to make a test run.
TEST RUNS
Our first attempt at injecting dye and creating a nice trace failed. Our syringe tip was too small, which made the dye velocity so fast that we could only create ink clouds in the flowing water, like from a squid. So we made a second dye-injection pipe with a slightly larger syringe tip to slow the dye injection velocity. This setup worked much better, and with some practice we could match the dye and water speeds and get a nice stream of dye right in the center of the flowing water.
Next, we needed to decide what observations to make and how to present them. We decided to record video segments of the flow at several different Reynolds numbers. Also, we wanted to display the Reynolds number for each corresponding flow condition. This meant we needed to accurately measure the water flow rate and temperature for each segment and calculate each Reynolds number. We ended up with nine useable video segments with Reynolds numbers ranging from 250-3970. We organized the segments in increasing order of Reynolds number and edited them into a 3-min. video.
According to the book, Marks’ Standard Handbook for Mechanical Engineers, flow inside a pipe will generally be fully turbulent when the Reynolds number reaches 4000. The completed video shows the interesting progression of coolant behavior from very slow laminar conditions transitioning to well-developed turbulent flow.
Here is some explanation of the changing conditions as flow rate and Reynolds numbers increase:
1) The slow, lazy laminar flow is very interesting to watch. At Reynolds 250-450 there is separation and rotating flow induced by the first turn in the cooling channel. This causes a minor disturbance in the flow that moves downstream as its energy is dissipated into the placid laminar flow. You can also see the dye trace dividing as the flow splits and passes some small air bubbles trapped in the passage. Of course, these conditions would not provide good cooling performance. When the flow is laminar it moves as a connected “chunk” of water with little mixing to promote good heat transfer.
2) At Reynolds 640-900, the corner circulation and induced downstream turbulence are more pronounced, but the flow leading to the first turn is still totally laminar. The induced turbulence is weak and insufficient to create good cooling performance.
3) At Reynolds number 1190, the dye trace shows the start of transition to turbulent flow but there remains a sheath of laminar flow around the turbulent center. The laminar layer provides resistance to heat transfer and degrades cooling performance.
4) Observing the change from Reynolds 1840 to 3970, one can see the gradual migration of the turbulent water to the walls of the passage, reducing the non-turbulent layer to a thin film inside the channel. This condition provides effective heat transfer and good cooling performance.
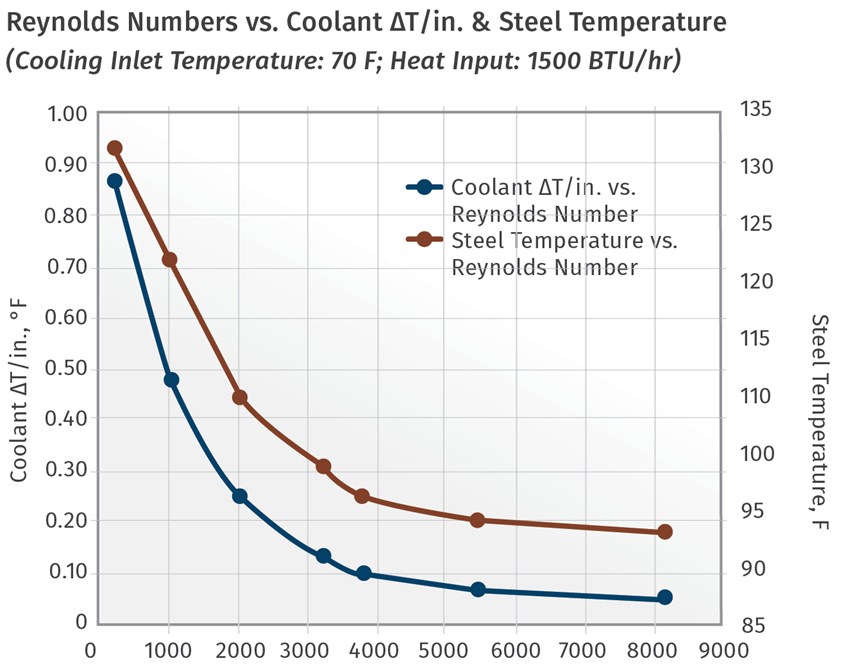
The video shows how the varying flow conditions look, but it is useful to relate the visual experience to cooling results. Accordingly, we designed a new study with a fixed heat input and with Reynolds numbers covering the full range of those in the video. We recorded coolant ∆T and mold temperature for each Reynolds number and then plotted the data, shown in the accompanying chart.
Before discussing the results, here’s a quick refresher on the Reynolds number (Re) calculation and what it means:
Re=(d x Q)/kv
d = Pipe ID, ft
Q = Flow, ft³/sec
kv = kinematic viscosity, ft²/sec.
Assuming a fixed pipe size, the two variables in the Reynolds number calculation are flow rate and viscosity. Water temperature makes a big difference in the viscosity and, thus, the Reynolds number. Surprisingly, kinematic viscosity values for water vary by a factor of 5 between 40 F and 200 F.
The units of kv and flow are admittedly inconvenient. To make the calculation easier we suggest using our online Turbulent Flow Calculator. Use it for calculating Reynolds numbers or determining flow and temperature conditions required to produce a desired Reynolds number. Simply enter circuit size, coolant temperature, and flow rate or desired Reynolds number. The calculator also allows for solutions of water and ethylene glycol.
WHAT IT ALL MEANS
First, consider the relationship between Reynolds number and mold temperature shown on the right vertical axis. Note how the graph has a steep slope in the laminar-flow range (Reynolds numbers 250-2500). This means that a relatively small change in Reynolds number causes a more pronounced change in mold temperature. This range should be considered a potentially unstable cooling process. Variations in coolant supply pressure or a slight flow blockage could trigger enough mold-temperature change to cause defective parts.
Next, consider Reynolds numbers in the range of 2500-4000. Notice that the slope of the graph changes to a nearly horizontal shape. Above 4000, increases in coolant flow rate have a minimal effect on mold temperature. We would consider this a stable cooling process, providing a measure of security.
Next let’s examine the relationship between Reynolds number and coolant ∆T/in. of circuit length. High values of ∆T/in. are associated with low Reynolds numbers and laminar flow. As Reynolds number increases and flow becomes turbulent, the curve bends and flattens out. Values of ∆T/in. decrease dramatically in this transition.
As Reynolds number increases further, only minimal change in ∆T/in. will occur, confirming that flow is turbulent.
Some closing observations:
• Actually seeing the dramatic change in flow behavior as the Reynolds number increases provides a great intuitive grasp of how turbulence improves cooling. Vigorous mixing is the key to quickly moving the heat from the inside wall of the cooling surface into the interior water. Seeing both the video and the data is even better.
• Watching the transition to turbulent flow might also give rise to the idea that there is an energy cost associated with pumping water fast enough to achieve turbulence.
• We talk a lot about our L-shaped curve of Reynolds number vs. cooling efficiency. It tells us that up to the turbulent transition and perhaps a little beyond, more coolant flow is changing things for the better. But is it also reminding us that going far beyond the transition to turbulent flow results in a diminishing cost-benefit ratio.
ABOUT THE AUTHOR
Phil Burger, P.E., founded Burger & Brown Engineering, Inc. in 1978 and served as president until 2005. Based in Grandview, Mo., Burger & Brown manufactures products related to mold cooling and in-mold sensing and holds 10 patents. Burger currently works part-time for the firm and has most recently developed an educational program called Scientific Cooling that was launched in October 2013. Contact: (816) 878-6675; pburger44@gmail.com; smartflow-usa.com.
Related Content
Water Temperature Control Upgraded and Integrated into Machine Control
Engel’s new eco-flomo temperature control system continuously monitors injection mold cooling and temperature control circuits, displaying pressure, temperature and flow rate values.
Read MoreNorth American Distribution for System to Track Cooling-Circuit Temperatures, Flow Rates
Globeius is now a North American supplier of Mouldpro’s Flosense 1.0 Flexible Flow Monitoring system for tracking manifold pressures and mold temperatures.
Read MoreCaptive Molder Beefs Up Auxiliaries to Boost Quality, Consistency
SeeScan adds conveying, drying, feeding and chilling technologies to improve quality — and enhance employee safety — in production of its underground/underwater inspection systems.
Read MoreTroubleshooting Leaky Temperature-Control Units
Learn the causes, symptoms and remedies for TCU leaks to keep these vital contributors to plastics processing up and running longer and more efficiently.
Read MoreRead Next
People 4.0 – How to Get Buy-In from Your Staff for Industry 4.0 Systems
Implementing a production monitoring system as the foundation of a ‘smart factory’ is about integrating people with new technology as much as it is about integrating machines and computers. Here are tips from a company that has gone through the process.
Read MoreLead the Conversation, Change the Conversation
Coverage of single-use plastics can be both misleading and demoralizing. Here are 10 tips for changing the perception of the plastics industry at your company and in your community.
Read MoreBeyond Prototypes: 8 Ways the Plastics Industry Is Using 3D Printing
Plastics processors are finding applications for 3D printing around the plant and across the supply chain. Here are 8 examples to look for at NPE2024.
Read More
