Injection Molding: How Repeatable is Repeatability?
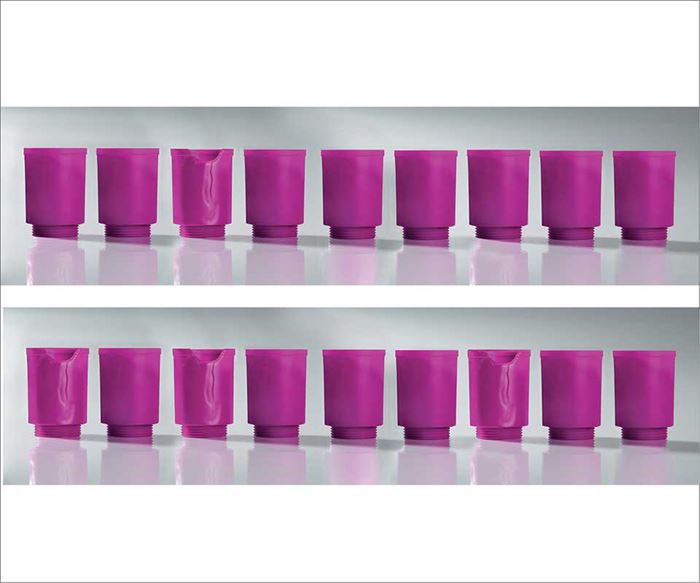
Process repeatability is not a constant, but varies over time in response to a number of variables. That variation is not captured by a snapshot in time—measuring a discrete sample of parts. And the only way to manage that variation is with process controls that adjust each and every cycle.
Repeatability means the ability to produce parts that have identical properties. It is therefore often necessary to assess production systems or their components in advance according to whether they ensure a repeatable process. But how?
High repeatability over a relatively long period generally requires high robustness to compensate for sudden or gradually changing disturbances. Such disturbances may include fluctuating ambient conditions or the wear of machine and mold. Material properties, too, may be subject to fluctuations from batch to batch, representing disturbances for the process.
During the lifetime of a process, who knows what disturbances may emerge, what their extent will be, and—most important—how much they will affect the quality of the part? In practice, these future scenarios are usually neglected; processors restrict themselves to making an inventory of the current repeatability. But on closer examination, even this proves to be a non-trivial challenge.
STANDARD DEVIATION & VARIATION
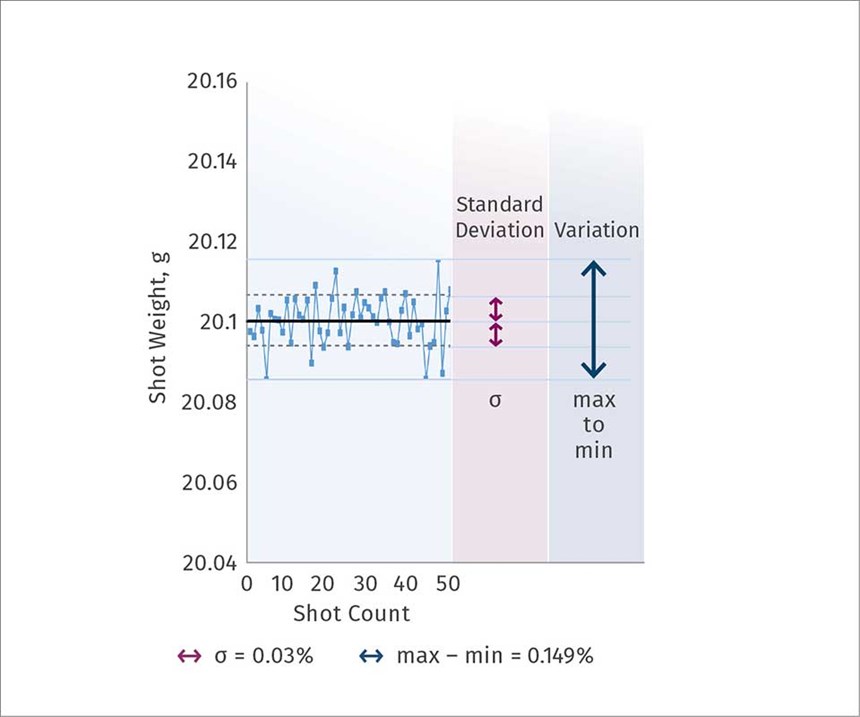
For rapid assessment of process repeatability, the shot weights for a number of successive cycles are usually measured. These values serve as basis for calculating the standard deviation or variation (Fig. 1). Both parameters are often expressed as a percentage of the mean shot weight. As a result, they can be better compared using empirical values.
Variations are considered very satisfactory if they lie below 0.1% of the mean part weight. The disadvantage of this consideration is that the variation is calculated from only two values: the biggest and the smallest measured value. What takes place between them is not taken into consideration. This minor short-coming can be pardoned, since the short-term repeatability in which, for example, 50 cycles are considered, actually conceals far more—but more about that later.
In the last decade, machine capability and process capability studies have become increasingly widespread. A determined number of parts are taken under defined conditions, and a property that is important for their subsequent function is measured. This property may be, for example, a critical dimension. Presupposing a normal distribution of samples, the previously mentioned standard deviation is determined. From this standard deviation and from the permitted tolerance for the property under consideration, machine capability indexes are calculated.
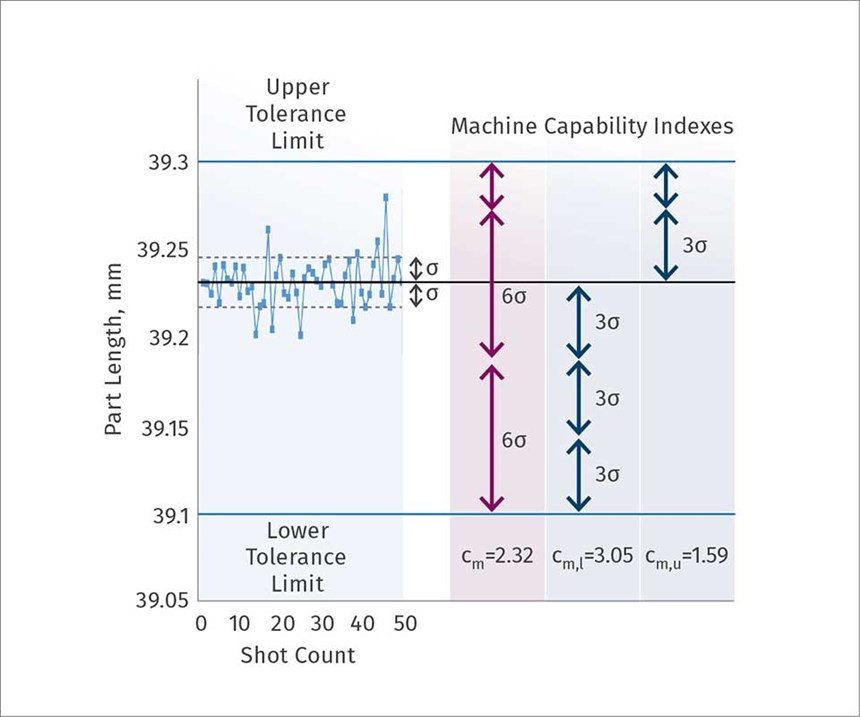
The machine capability index (cm) indicates how often six times the standard deviation fits into the given tolerance band. In one case example (Fig. 2), six times the standard deviation for part length is illustrated with six vertically stacked double arrows in red. As can be seen, the arrows fit about 2.3 times between the lower and upper tolerance limits. A value of cm >1.67 is usually required.
The lower machine capability index cm, l indicates how often three times the standard deviation fits between the target value and lower tolerance limit; while the upper index cm, u states how often it fits between the target value and upper tolerance limit. In the case example, three times the standard deviation is represented as three vertically stacked double arrows in blue. As can be seen in Fig. 2, the arrows fit about three times between the lower tolerance limit and mean value, but only 1.59 times between the mean value and upper tolerance limit.
Cm,l and cm,u thus describe the position of the measurement values within the tolerances. The larger the index is, the farther the measurement values are from the corresponding tolerance limit. Since a small value is consequently a problem, the smaller of the two values cm,l and cm,u is designated as a critical machine capability index cm,c. In the example in Fig. 2, cm,u would thus be the critical value. A value >1.67 is also usually required for this. While the scattering of the values with a cm of 2.3 meets the requirements, cm,u at 1.59 is too low—the part-length measurements lie close to the upper limit. One would then change the setting parameters in order to influence the shrinkage and so reduce the length somewhat. If this is not possible, the mold geometry would have to be changed.
PITFALLS OF REPEATABILITY MEASUREMENT
If the injection molder has performed a repeatability test, he obtains at least one of the above-described numerical values. This allows the process—or, more accurately, a snapshot of the process—to be assessed. It has been found in practice that the results of a repeatability measurement often do not stand up to closer scrutiny. There are a host of error sources, the most common of which are described below:
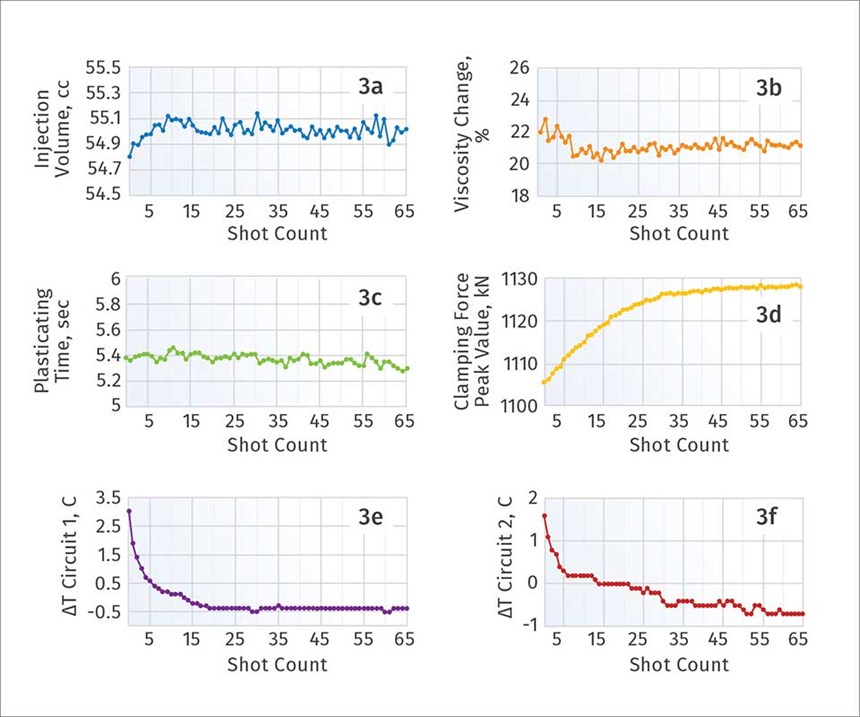
• Premature Measurements The first error occurs when at the end of a busy day there is not enough time to do measurements properly. If technicians decide to quickly take parts from 50 shots and place them on the scales, they often find out too late—namely, when the shot weights are available, or in an extreme case, never—that the process had not settled down (Fig. 3). Before the repeatability test, it should therefore always be determined whether the process is in a stable state (see Practical Tip 1 below).
• Erroneous Measurements The next pitfall comes during weighing. You could think that the ability to use a set of kitchen or bathroom scales would be adequate for deter- mining the weight in the repeatability test. That’s a mistake! Like any other measurement skill, weighing must be learned. The operator’s instrumentation proficiency must be ascertained, and air drafts must be avoided. It is advisable to weigh not in the production environment, but in a lab, and the parts must not overhang the weighing pan.
It should also be observed that different storage times after removal can falsify the result due to different moisture absorption; the same applies to electrostatic charging of the parts, attracting dust and stray particles. The last point is not widely known. It is therefore advisable to discharge the parts with ionized air.
• Suboptimum Settings Anyone who has followed the tips so far will probably obtain a correct result—more precisely, a result that is correct under the given conditions. One of the key conditions is the operating point—i.e., the total of all the settings that the user has chosen. To make things a little more complicated, process repeatability is dependent on the settings. If the mold temperature is reduced somewhat, or the injection velocity increased, the repeatability can change—both in short-term tests and, probably even more, in the longer term.
In practice, it will be difficult to optimize both the robust- ness and repeatability during process optimization. Usually it is enough to perform at least one optimization according to the conventional rules of injection molding. Two key indicators for the quality of a setting are mentioned here as examples: First, can the injection drive follow the selected injection velocity profile? That would not be the case if the injection-pressure limit chosen for mold protection is reached.
Second, is the injection-pressure curve predominantly the same from shot to shot? This would not be the case, for example, if cold slugs in the nozzle caused fluctuations at the beginning of the injection process.
Modern machine controls, like the CC300 from Engel, help engineers to find answers to these questions, and thereby fulfill important prerequisites for the robustness of the injection molding process (see Practical Tip 2 at bottom of article).
• Repeatability Tests with Process Data Measurement is difficult and expensive. Why not, as a first approximation, use process data—i.e., actual values from the machine—instead of measurements on the part to judge process repeatability? Do not a uniform melt cushion and a stable metering time already say a lot about the quality of the machine?
However convenient that approach may seem, it is not possible to relate such process data to the part quality. It becomes particularly critical when a machine capability index is calculated from process data. As described above, this requires tolerance limits. For process data, however, such tolerance limits cannot be found in the part drawing. They must be freely invented, which takes us directly to the next point.
• Relaxed Handling of Tolerance Limits “The simplest way of increasing the process capability of a given process consists in relaxing the specification limits” (Wikipedia). For instance, the greater the difference between the upper specification limit and lower specification limit, the more standard deviations can be accommodated between them. These obvious truths should not be used as a guide to self-deception. If the tolerance limits are freely invented, and the desired machine capability is not reached, it is tempting simply to reinvent the limits. Judging the advisability of this method is left to the reader.
ASSISTANCE SYSTEMS FOR PROCESS CONTROL
Anyone who is aware of the above-described pitfalls can sidestep them where possible and thereby obtain a value for the repeatability that is actually convincing—at least for the moment. As mentioned above, it is not foreseeable how disturbances will change in future and how they will consequently influence the quality of the parts and the repeatability of the process.
A solution to this problem is offered by new intelligent assistance systems for process quality. One example is “iQ weight control” from Engel. The software module forms an automatic control loop that is superimposed on the familiar injection and holding-pressure controllers. When the disturbances change, it adapts the injection, changeover, and holding-pressure parameters in real time—during the same cycle—so that the shot weight remains largely constant. This software package is part of the “inject 4.0” program, with which Engel is paving the way to the smart factory for its customers.
For processes with poor repeatability in short-term tests, the software can provide an immediate improvement. If, on the other hand, the repeatability in short-term tests is very good, the software will not appear to offer any further improvement at first sight. Nevertheless, iQ weight control continually monitors the injection volume and intervenes reliably when something changes. The system is thus an insurance that the process will continue to run reliably in future. The good thing about this type of insurance is that it does not wait for an error signal to be activated. It is already active before the rejects are produced.
PRACTICAL TIP 1: Has the Process Settled Down?
In most cases, it is difficult to assess whether a process has settled down. To make an assessment of this kind, it is necessary to monitor multiple parameters shot by shot over a relatively long period. Some modern controls, like the latest CC300 machine control system from Engel, offer the possibility of graphically displaying process parameters. This allows changes in the process or the state of the process to be assessed at a glance—in up to six graphs on one screen page, in the case of the CC300. Searching for changes in apparently infinite columns of figures is thus a thing of the past.
Machine-specific parameters or process-specific parameters give an indication of whether a process has settled down or not. On start-up of the machine, it can be seen (Fig. 3) that the process-specific parameters of injection volume (3a), viscosity change (3b), and plasticating time (3c) are stable after just a few cycles.
Given the temperature differences between the inlet and return in the mold-cooling circuit (3e and 3f), it should be observed that the two cooling circuits have not settled down at the same point in time. In this case, the difference can be explained by the fact that the two temperature circuits supply different regions of the mold. If the mass to be cooled is larger, it takes longer for a stable temperature difference to be established.
In the case of toggle machines, the clamping-force peak value (3d) changes as the mold is brought up to its service temperature because of thermal expansion. This parameter is particularly suit- able for assessing whether the mold is already heated throughout.
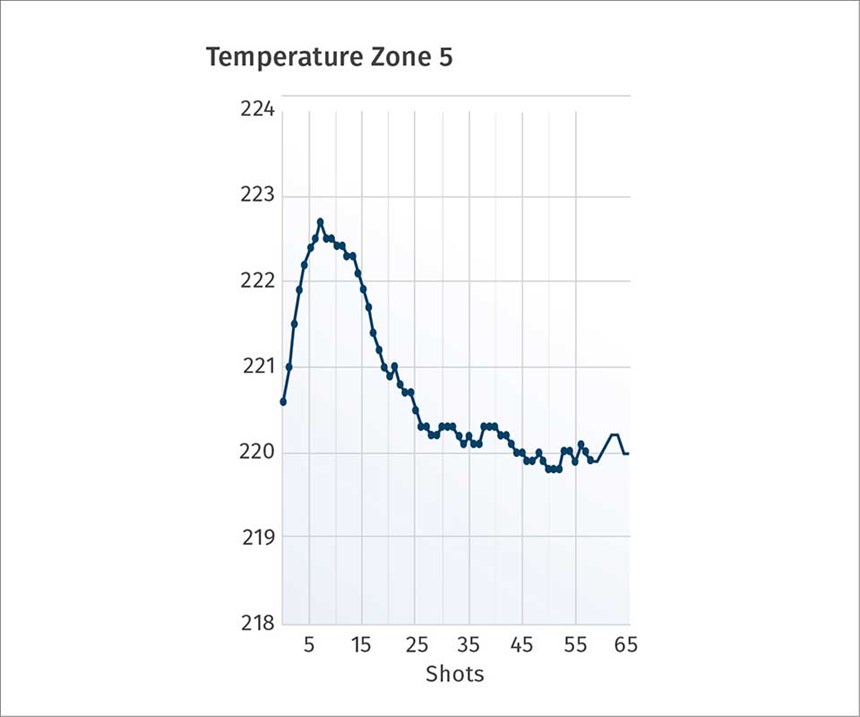
For the case in which six graphs are not enough, or where it is desired to investigate the profile of any other arbitrary parameter in the process data log and display it graphically, the CC300 allows the operator to simply tap into the column of the particular data value. For example, the quick graph generated in this way can show that at least 25 cycles are necessary before the temperature of a cylinder zone has settled down (Fig. 4).
PRACTICAL TIP 2: Actual-Value Display in the Target-Value Graph
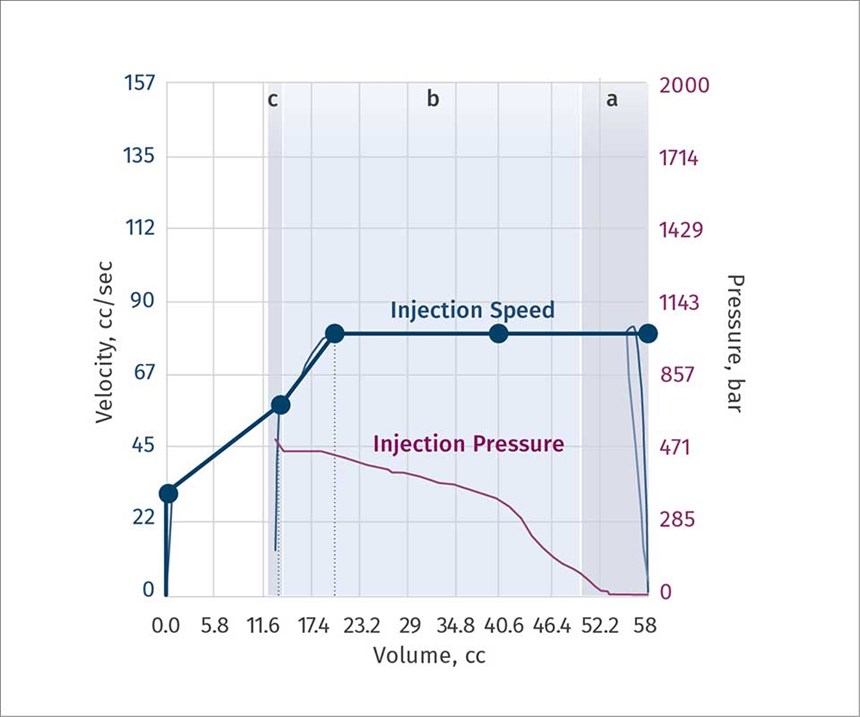
One value per cycle is recorded in the process-data log and in the associated graphs. However, these records do not give any information about the variation of values within a cycle. But controls like the CC300 let the user display the actual-value curves for injection velocity and injection pressure together with the target-value profile of the injection velocity (Fig. 5). This allows a simple check of whether and how the injection drive follows the set injection velocity. Moreover, the profile of the injection pressure can be observed and analyzed for irregularities (pressure spikes during injection, differences at the beginning of the pressure curve as a result of cold plugs, etc.).
The so-called “actual-value display” in the target-value graph, which is read from right to left, is subdivided into three regions on the CC300 display screen (Fig. 5). Region a, on a dark-blue back- ground, marks the transition through the compression relief. Region b, on a light-blue background, models the velocity-controlled phase of the injection process. The changeover point takes place at the transition from b to c. That in turn means that region c is part of the pressure-controlled phase of the injection molding process. The curves illustrated here show that the injection drive in this example follows the preset profile and there are no abnormalities, such as pressure spikes, during the injection.
ABOUT THE AUTHORs: Dipl.-Ing. Josef Giessauf is Head of Process Technology Development at Engel Austria GmbH, Schwertberg, Austria. He started in Engel’s Technology Development department in 1995 and has worked in such areas as process analysis, overmolding of textiles and films, variotherm molding, mold-temperature control, injection-compression, and molding of optical parts and glazing. Contact: josef.giessauf@engel.at; engel.at.
Christian Maier, M.Sc., is project manager in the Process Technology Development department at Engel Austria. He joined Engel in that department in 2011, and has worked on process engineering and molding of optical parts. Contact: christian.maier@engel.at.
Related Content
Using Data to Pinpoint Cosmetic Defect Causes in Injection Molded Parts
Taking a step back and identifying the root cause of a cosmetic flaw can help molders focus on what corrective actions need to be taken.
Read MoreHow to Select the Right Tool Steel for Mold Cavities
With cavity steel or alloy selection there are many variables that can dictate the best option.
Read MoreIs There a More Accurate Means to Calculate Tonnage?
Molders have long used the projected area of the parts and runner to guesstimate how much tonnage is required to mold a part without flash, but there’s a more precise methodology.
Read MoreThree Key Decisions for an Optimal Ejection System
When determining the best ejection option for a tool, molders must consider the ejector’s surface area, location and style.
Read MoreRead Next
See Recyclers Close the Loop on Trade Show Production Scrap at NPE2024
A collaboration between show organizer PLASTICS, recycler CPR and size reduction experts WEIMA and Conair recovered and recycled all production scrap at NPE2024.
Read MoreMaking the Circular Economy a Reality
Driven by brand owner demands and new worldwide legislation, the entire supply chain is working toward the shift to circularity, with some evidence the circular economy has already begun.
Read MoreFor PLASTICS' CEO Seaholm, NPE to Shine Light on Sustainability Successes
With advocacy, communication and sustainability as three main pillars, Seaholm leads a trade association to NPE that ‘is more active today than we have ever been.’
Read More
