MATERIALS: The Problems with Single-Point Data--Part 6
Data sheets can be limited in the information they provide on how the material performs at elevated temperatures.
As we have mentioned in previous installments of this series, almost all the values that appear on a data sheet are measured at room temperature, which is given as 73 F (23 C). Data sheets make a limited attempt to provide some information on how materials perform at elevated temperatures. This comes in the form of the deflection temperature under load (DTUL), also known as the heat deflection temperature (HDT), or the Vicat softening point. As with all of the values provided on a data sheet, the tests used to develop the reported values are governed by various ASTM or ISO methods.
These methods have the same problems as the tests used to measure mechanical properties. First, they represent a point on a curve. The curve is something we are perfectly capable of generating, and the complete picture embodied in the curve contains much more information than the number in a column on a data sheet. Second, there are so many different methods that can be used to conduct these tests, and so many variants within these methods, that even the relatively useless data points provided by the tests are not helpful in comparing the properties of different materials.
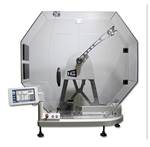
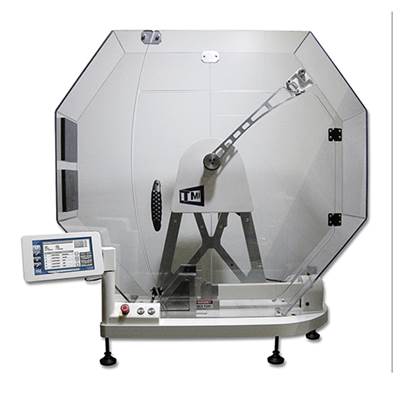
Let’s look at what the DTUL test actually does. The accompanying photo shows the test apparatus. Today’s instruments may contain multiple stations for testing many specimens simultaneously, and the analog thermometer and gauge that measures deflection have been replaced with digital readouts. But the principle remains the same. A sample is placed on a three-point bending fixture that is immersed in a fluid to optimize heat transfer. The load required to generate the appropriate stress is applied, the fluid is heated at a rate of 2° C/min (3.6° F/min), and the deflection is monitored until it reaches the defined value that signals the conclusion of the test. The temperature of the fluid at the point where this deflection is attained is the deflection temperature under load.
The stresses used to conduct the test under the ASTM protocol are 66 psi (0.455 MPa) and 264 psi (1.82 MPa). The ISO version has retained the 0.455 MPa stress, rounded the higher stress down to 1.80 MPa, and instituted a third stress level of 8 MPa, or about 1160 psi.
Not surprisingly, since the end of the test is defined by a particular amount of deflection, this benchmark is reached at a lower temperature as the stress level increases. Therefore, when a material is characterized at both 66 psi and 264 psi, the DTUL will be higher at 66 psi stress. For some materials, the temperature difference may be as little as 5° C (9° F) while for others it can be over 100° C (180° F).
While the stresses and the heating rate are prescribed by the test, there are some aspects of the evaluation process where a surprising amount of variation is permitted. One of these is the specimen geometry. Most test specimens under the ASTM protocol are 0.125 in. thick. However, specimen thicknesses of 0.250 in. and even 0.500 in. are allowed. It should be fairly obvious that thicker specimens produce a higher DTUL value. Sample preparation is also open to some variation. While most samples are injection molded, specimens can also be compression molded or machined from extruded sheet. The influence of this parameter may not be as obvious as the effect of sample thickness.
However, an element of how a material deflects under load is related to the level of internal stress in the molded specimen. Internal stresses tend to be higher in injection molded specimens than in extruded or compression molded ones. Therefore, injection molded parts give the lowest values for this test. Finally, it is permissible to anneal test specimens before subjecting them to the DTUL test. Annealing reduces the internal stress in the specimen and therefore improves the measured DTUL.
Those who are responsible for performing the tests are supposed to provide information on these variables. Sometimes they do and sometimes they don’t. But even when they do, it is up to the consumer of the information to guess at the quantitative effect that these parameters have on a test result. Therefore, if an ABS provided by Supplier A has a DTUL of 110 C (230 F) using annealed specimens, and an ABS from Supplier B has a DTUL of 100 C (212 F), there is no guidance on whether this difference is due entirely to the annealing process or if it is only part of the reason for the variance.
The Vicat softening test also has some built-in latitude that can make an interpretation of the data somewhat challenging. The accompanying photo provides a picture of this test apparatus, as well. In this case, a needle of a specific area is placed on the sample and one of two loads is applied while the temperature of the specimen is increased at one of two rates. The load can be either 10 Newtons (2.24 lb) or 50 N (11.2 lb) and the heating rate can be either 50° C/hr (90° F/hr) or 120° C/hr (216° F/hr). The temperature of the specimen at the point where the needle penetrates the sample to a particular depth is considered to be the Vicat softening point. In this case, because both heating rate and load can be varied at will, data interpretation can be interesting, to say the least.
For example, a polypropylene homopolymer gives a published Vicat softening point of 85 C (185 F). A closely related random copolymer from the same producer provides a published value of 151 C (304 F). To those who know something about the relationship between structure and properties, this should be rather confusing, since homopolymers are typically more crystalline than copolymers and therefore should be stiffer and have somewhat higher softening and melting points. The inversion is caused by a change in the test method. While both samples were tested using the same heating rate, the homopolymer was tested using the higher load while the copolymer was tested using the lower one. This is not stated explicitly on the data sheets. The heating rates and loads are designated by codes. The lower load is referred to as Vicat A and the higher load is referred to as Vicat B. This is the extent of the information that will typically be provided in the footnotes.
To many people viewing these data, this comparison looks like a nonsensical outcome. And in fact, it is. Softening implies the approach of a change in the state of a material. In PP, which is semi-crystalline, it would involve melting. A proper analysis of a random copolymer by a technique known as differential scanning calorimetry actually does show that the crystalline melting point of a random copolymer is almost exactly equal to the Vicat softening point. However, the homopolymer melts at approximately 160-165 C (320-329 F). So what utility does a value of 85 C have on the data sheet other than to dissuade potential users of the material from going near it for high-temperature applications? In fact, this material is sold into applications that see long-term exposure to temperatures as high as 120-125 C. Did I mention that these two grades are made and tested by the same supplier?
But there is a deeper question here. What exactly are we measuring when we perform these tests, and does it help us make intelligent decisions about fitness for use? This is a question we will address next month.
ABOUT THE AUTHOR: MIKE SEPE
Mike Sepe is an independent, global materials and processing consultant whose company, Michael P. Sepe, LLC, is based in Sedona, Ariz. He has more than 35 years of experience in the plastics industry and assists clients with material selection, designing for manufacturability, process optimization, troubleshooting, and failure analysis. Contact: (928) 203-0408 • mike@thematerialanalyst.com.
Editor’s note: You can read the next part in the series by clicking here.
Related Content
Lanxess and DSM Engineering Materials Venture Launched as ‘Envalior’
This new global engineering materials contender combines Lanxess’ high-performance materials business with DSM’s engineering materials business.
Read MorePrices Up for All Volume Resins
First quarter was ending up with upward pricing, primarily due to higher feedstock costs and not supply/demand fundamentals.
Read MoreThe Effects of Stress on Polymers
Previously we have discussed the effects of temperature and time on the long-term behavior of polymers. Now let's take a look at stress.
Read MorePrices Up for PE, PP, PS, Flat for PVC, PET
Trajectory is generally flat-to-down for all commodity resins.
Read MoreRead Next
MATERIALS: The Problems with Single-Point Data
In plastics, notched Izod and Charpy test results have been complicated by the way they are reported.
Read MoreMATERIALS: The Problems with Single-Point Data
Engineers who are used to working with metals are surprised that plastics cannot operate as close to their yield points as can metals. The yield point is not enough to tell you how the material reacts to stress.
Read MoreMATERIALS: Impact Testing: The Problems With Single-Point Data
Knowledge of test conditions and graphical data showing the course of the impact event can help provide engineers and designers with the information they need to make informed choices about material toughness.
Read More
.jpg;width=70;height=70;mode=crop)
