MATERIALS: The Problems with Single-Point Data: Part 9
Time—and not just temperature—governs the behavior of materials under load. Both must be considered when evaluating a polymer for an application.
In previous columns in this series, we have demonstrated the capability of dynamic mechanical analysis (DMA) to determine the modulus of a polymer at virtually any temperature, and the advantage that this has over the traditional deflection temperature under load (DTUL) measurement. But time is another factor governing the behavior of plastic materials that must be considered.
Modulus defines the relationship between stress and strain at the moment a load is applied. However, if a load is maintained over a period of time, it is known that the strain exhibited by the material will increase over this time period. This additional strain is known as creep strain. We can measure this creep strain directly over time. Another way of depicting this time-dependent behavior is through measurement of a property known as the creep modulus or the apparent modulus.
In a creep experiment, the stress is constant by definition while the strain is continually increasing. Since the modulus is the ratio of stress divided by strain, the modulus appears to be decreasing over time. The true rigidity of the material is not significantly affected; the creep or apparent modulus is a mathematical construct for expressing the relationship between a constant stress and an ever-increasing strain. If this property appears on a data sheet, it will be quoted at a particular time or times and the value becomes smaller at longer times as the creep strain increases. A graphical output will plot creep modulus as a function of time if the experiment has been carried out in a manner that provides enough data points.
There was a time in our industry when a significant amount of effort went into studying the time-dependent behavior of plastic materials under load. Most of this work was conducted by the companies that supply the raw materials. To be of value, real-time creep experiments require long time frames and can be costly to perform. As the industry has matured, resin suppliers are not as willing to devote the needed resources to these long-term programs. But at the same time, end users are seeking to develop applications that place these materials under increasing mechanical demands in many different environments. Where is the guidance supposed to come from that will provide the assurance of success before the product-development cycle begins?
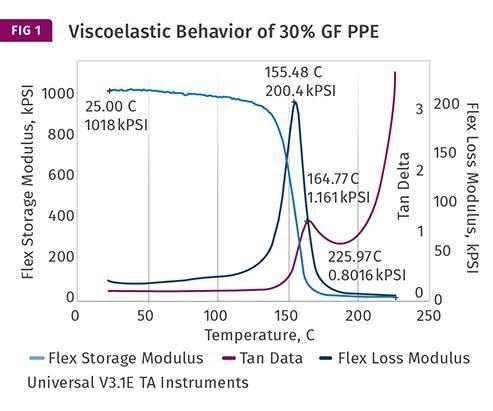
Fortunately, one of the fundamental principles of viscoelastic behavior is that the effects of temperature and time are equivalent. Therefore, we can obtain at least an approximation of how a material will behave under load over time by examining the plot of mechanical behavior with temperature. Figure 1 shows the behavior of a 30% glass-fiber reinforced PPE as a function of temperature. This graph shows all three of the key properties that are measured during a DMA test. The property of greatest interest to most engineers is the storage or elastic modulus, plotted in light blue. While this is not precisely the same as the more well-known Young’s modulus, the two values are extremely close to each other and are often used interchangeably.
PPE is an amorphous polymer and follows the behavior associated with this class of materials. For this material the elastic modulus remains nearly constant across a broad temperature range between room temperature and 125 C (257 F). At this point the elastic modulus begins to decline while at the same time the viscous or loss modulus, plotted in blue, begins to increase. This represents the early stages of the glass transition, an event that signals an increased freedom of molecular movement within the polymer matrix, which ultimately results in the complete loss of useful mechanical properties in amorphous polymers that are not crosslinked. Most of this change in performance occurs between 125-175 C (257-347 F). The glass-transition temperature is identified by convention as the peak temperature of the loss modulus curve, 155.48 C (311.86 F)
However, it is obvious that this is a process that unfolds over a relatively broad temperature range and not an instantaneous change that can be denoted by a single temperature.
Because the glass transition is a relaxation process, the rate at which it occurs is dependent on both temperature and time, and the effects of these two parameters are interchangeable. In other words, the dramatic loss in elastic modulus associated with increasing temperature reflects an equally catastrophic decline in creep modulus as a function of time at any particular temperature. At temperatures very far from the glass transition, such as room temperature, the time scale required to effect large changes in creep modulus will be very long. However, as we approach the glass-transition temperature, the time scales will become much shorter.
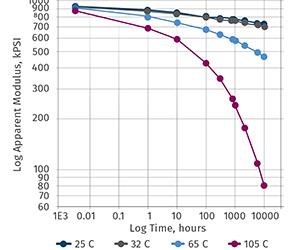
Figure 2 shows a series of creep modulus curves for the 30% glass-reinforced PPE plotted as a function of time at multiple temperatures up to a time frame of 10,000 hr. Remember that a decline in creep modulus is associated with a corresponding increase in creep strain. Therefore, a plot of creep modulus that shows little decline, such as the ones for 25 C (77 F) and 32 C (90 F), is associated with very small amounts of creep strain and therefore good mechanical stability under load.
However, as the temperature increases, the rate of decline becomes greater despite the fact that the modulus at the beginning of the test has changed very little. The creep modulus curve for the 65 C (149 F) test begins to show the effects of the modulus reduction associated with the glass transition. At 105 C (221 F), a temperature that is still on the plateau shown in Fig. 1, the initial modulus at time zero has barely changed compared with the room-temperature value. However, the time-dependent behavior clearly shows the effect of proximity to the glass transition. At 10,000 hr, the apparent modulus has declined to approximately 80 ksi from an initial value at time zero of nearly 900 ksi. In other words, under stress the apparent modulus has followed a plot that is reflected in the temperature-dependent behavior of the material even though the temperature of the creep test has not appreciably reduced the measured modulus at time zero.
This shows that in the absence of actual creep data, the plot of modulus as a function of temperature provides a semi-quantitative prediction of the time-dependent response of the material under load. If you want to know the effect of constant stress on a material at a given temperature, simply find the application temperature on the elastic modulus curve and then look to the right at the effect of increased temperature. If the plot shows little change over a significant temperature range above the application temperature, this indicates that the material will exhibit good creep resistance. If a large change in modulus occurs just above the application temperature, then a substantial degree of creep strain can be expected. The exact amount of strain will depend upon the applied stress and whether the level of strain falls in the linear or non-linear region of the stress-strain curve. Stress, temperature, and time are the three factors that govern the creep behavior of a material.
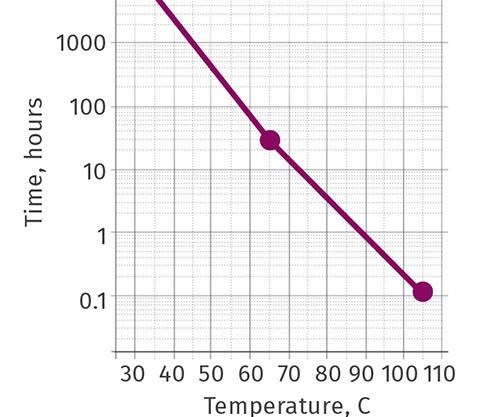
Figure 3 shows a semi-logarithmic plot of the time required to reach a particular creep modulus as a function of temperature. Because the initial modulus changes very little for this material as a function of temperature, the time at which a particular creep modulus is attained can be equated with the time at which a particular creep strain is reached. Note that when plotted in this manner, the relationship is very nearly a straight line. This allows for interpolation along this line to time-temperature relationships that have not been experimentally determined. It also illustrates the manner in which increases in temperature accelerate the creep process.
In my next column I will illustrate a practical example of how this time-temperature equivalence was used to solve a problem with material performance that the standard deflection temperature under load failed to predict.
ABOUT THE AUTHOR
Related Content
Understanding Melting in Single-Screw Extruders
You can better visualize the melting process by “flipping” the observation point so the barrel appears to be turning clockwise around a stationary screw.
Read MoreA Systematic Approach to Process Development
The path to a no-baby-sitting injection molding process is paved with data and can be found by following certain steps.
Read MoreInjection Molding: Focus on these Seven Areas to Set a Preventive Maintenance Schedule
Performing fundamental maintenance inspections frequently assures press longevity and process stability. Here’s a checklist to help you stay on top of seven key systems.
Read MoreWhere and How to Vent Injection Molds: Part 3
Questioning several “rules of thumb” about venting injection molds.
Read MoreRead Next
MATERIALS: The Problems with Single-Point Data, Part 7
The industry can choose between continuing to perform DTUL tests that provide single points that are part of a curve never seen, or perform the test that provides the entire curve.
Read MoreMATERIALS: The Problems With Single-Point Data
Polymer properties are not constant as a function of temperature, and even small temperature changes can affect properties.
Read MoreMATERIALS: The Problems with Single-Point Data, Part 8
DTUL tests may have made sense in the 1940s and 1950s, before the advent of dynamic mechanical analysis. But designers and engineers today need better tools.
Read More
.jpg;width=70;height=70;mode=crop)
