Melt Flow Rate Testing – Part 2
To fully appreciate the strengths and weaknesses of the melt-flow-rate (MFR) test it is important to know something about the way the test is performed.
In order to fully appreciate the strengths and weaknesses of the melt-flow-rate (MFR) test it is important to know something about the way the test is performed. The methodology is covered by ASTM D 1238, while the corresponding international standard is ISO 1133. There are small differences between the methods, but they essentially perform the same function. (Link to Part 1 top right of this page.)
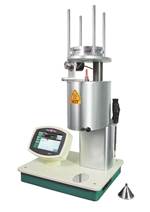
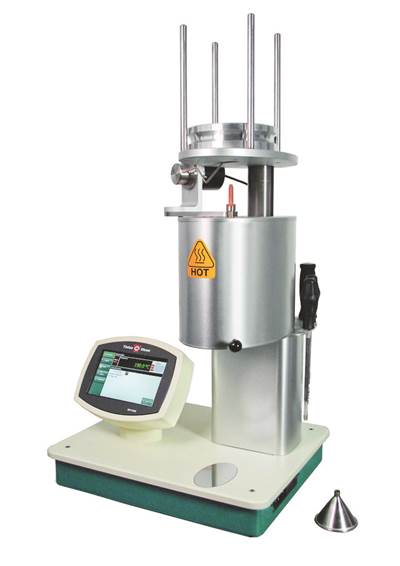
Both establish the rate at which a polymer flows under very specific conditions through an instrument with a very specific geometry. For the ASTM method, the cylinder into which the material is loaded has a diameter of 0.376 in., and at the bottom of the cylinder is a removable insert with an even smaller opening or orifice, as it is usually designated. While a few materials are tested using a non-standard orifice, the standard opening has a height of 0.315 in. +0.001 in. and a diameter of 0.0825 in. +0.00025 in.
The tolerances here suggest that the dimensions of the flow path are considered to be critical…and they are. The MFR instruments come with a go/no-go gauge for the orifice diameter that must be used regularly to ensure that the opening is within specification. Orifices are available in different materials and some are more durable than others, particularly against the effects of aggressive cleaning that can enlarge the opening. In addition, cleaning the top and bottom surface of the orifice can reduce the height. These are factors that can detract from the accuracy of the measurements.
Assuming the physical equipment is in good condition, the test involves first establishing the appropriate temperature for the material being tested. The prescribed temperatures are polymer-specific: Polycarbonate (PC) is typically tested at 300 C, polyethylene at 190 C, etc. For some polymers there are two or even three recognized conditions that may be used and it is usually the resin supplier that decides which one it uses. Probably the best example of this is ABS, where one of three different temperatures can be used to perform the test. So when performing incoming quality-control tests it is important to use the same conditions as your material supplier if you expect to get the same results. Just as with orifice geometry, temperature calibration is very important.
The other key input parameter is the mass that is placed on the material sample once it has been loaded into the cylinder and brought up to the specified temperature. This is also a polymer-specific setpoint and it can be a single number agreed upon by all, such as 1.2 kg for PC, or it can be one of two or three values, as in the case of ABS. For each of the three temperatures that can be used to test ABS there is a particular mass that accompanies that temperature. You can use 200 C with a 5 kg load, 230 C with 3.8 kg, or 220 C with 10 kg. And, yes, each condition will give you a different result for the same compound. The actual MFR value provided by the test is expressed in grams/10 minutes and is governed by the test conditions and the composition of the material being tested.
Here is the important fundamental regarding this test: The load is the input that drives the material through the orifice; the flow rate is the output. Consequently, the MFR test is a constant-shear-stress test, not a constant-shear-rate test. By definition it is a pressure-limited configuration. In this respect it is different from a capillary rheometer, a device for measuring viscosity that can control and vary the flow rate of the test while measuring the force required to achieve that flow rate.
Capillary rheometry is a controlled-shear-rate test and can provide a true measurement of viscosity, or resistance to flow. And because the viscosity of a polymer varies with flow rate, or shear rate, a complete characterization of viscosity must allow for measurements at multiple shear rates and the production of a graph that captures this relationship. Figure 1 shows a capillary rheometer output for two polypropylene materials.
This is where one of the common criticisms of the MFR test comes in. Critics point out that while capillary rheometry provides a complete picture of the relationship between viscosity and shear rate across a wide range of conditions that mirror many different processes, the MFR captures only one point on the curve.
This is true. The question is, “So what?” This critique implies that the MFR test was designed to provide some indication of processability. That was never its primary purpose. Instead it is intended to provide a simple way of measuring the relative average molecular weight (MW) of the polymer. As MW decreases, MFR increases. Since MW weight drives performance in polymeric materials, this is something that should be of interest.
When a polycarbonate supplier creates a range of grades distinguished primarily by their MFR, it is identifying the products according their average MW. Molecular weight influences impact performance, fatigue resistance, creep resistance, environmental stress-crack resistance, and barrier properties. The higher the MW, the better the performance. When a supplier establishes a specification range around a published nominal MFR value for a grade, it not doing so because it is concerned with how the material will process in a particular piece of equipment. The supplier monitors the MFR because it knows this is an indicator that the average MW of the material is under control and within the agreed-upon range.
The actual MFR value certainly has implications for processing. No one would pretend that a polycarbonate with an MFR of 4 g/10 min will flow as far through the same flow path and under the same molding conditions as one with an MFR of 20. But the real difference in viscosity is not as large as these numbers would suggest, because the difference in the flow rate automatically means a difference in shear rate, and with higher shear rates come lower viscosity. The shear rate at which an MFR test is performed is actually proportional to the MFR value itself. Multiplying the MFR by approximately 2.2 will give the shear rate at which the test was performed. So a 4-melt material is tested at a shear rate of about 8.8 sec-1 while the 20-melt material is tested at 44 sec-1. Not only are these shear rates different, they don’t represent the shear rates experienced by polymers under most melt processes.
In the next article we will explore the quantitative relationship between MFR and MW, the utility of using low shear rates to measure MW, and the reasons why some processors are convinced that variations in their process are caused by lot-to-lot variation in the MFR of the material.
Related Content
Lanxess and DSM Engineering Materials Venture Launched as ‘Envalior’
This new global engineering materials contender combines Lanxess’ high-performance materials business with DSM’s engineering materials business.
Read MoreThe Effects of Time on Polymers
Last month we briefly discussed the influence of temperature on the mechanical properties of polymers and reviewed some of the structural considerations that govern these effects.
Read MorePart 3: The World of Molding Thermosets
Thermosets were the prevalent material in the early history of plastics, but were soon overtaken by thermoplastics in injection molding applications.
Read MoreThe Importance of Melt & Mold Temperature
Molders should realize how significantly process conditions can influence the final properties of the part.
Read MoreRead Next
Melt Flow Rate Testing–Part 1
Though often criticized, MFR is a very good gauge of the relative average molecular weight of the polymer. Since molecular weight (MW) is the driving force behind performance in polymers, it turns out to be a very useful number.
Read MoreMaking the Circular Economy a Reality
Driven by brand owner demands and new worldwide legislation, the entire supply chain is working toward the shift to circularity, with some evidence the circular economy has already begun.
Read More
.jpg;width=70;height=70;mode=crop)


