New Graph Interpretation Course for Injection Molding
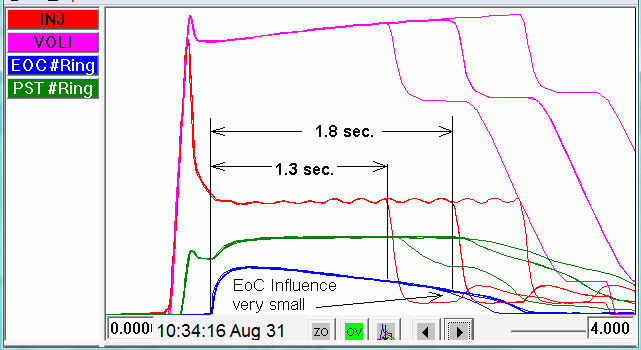
RJG’s newest training course—Graph Interpretation for Injection Molding— introduces the principles of Decoupled Molding and the cavity pressure curves associated with such processes.
RJG has introduced a three-day Graph Interpretation Course for injection molding in support of the Decoupled Molding process the company trains on and supplies equipment for. Designed for technical and non-technical personnel involved in thermoplastic injection molding, the Graph Interpretation Course provides both classroom and hands-on training, covering practical applications that introduce the principles of Decoupled Molding and the curves associated with such processes.
Areas covered include the Decoupled Molding cycle; how graphs work; graph scaling; overlays and templates; cycle graphs; summary graph data; bar graphs; alarms or limits for abnormal cycle detection; and identifying mold, machine and process issues using curves. The first course will be held in Kannapolis, N.C. on Dec. 13-15, 2022. RJG recommends that attendees have a basic understanding of the injection molding process.

RJG’s newest course will teach attendees how to interpret the graphs that chart a decoupled molding process.
Photo Credit: RJG
Related Content
-
Three Key Decisions for an Optimal Ejection System
When determining the best ejection option for a tool, molders must consider the ejector’s surface area, location and style.
-
Understanding the Effect of Pressure Losses on Injection Molded Parts
The compressibility of plastics as a class of materials means the pressure punched into the machine control and the pressure the melt experiences at the end of fill within the mold will be very different. What does this difference mean for process consistency and part quality?
-
Is There a More Accurate Means to Calculate Tonnage?
Molders have long used the projected area of the parts and runner to guesstimate how much tonnage is required to mold a part without flash, but there’s a more precise methodology.


