How to Achieve Simulation Success, Part 2: Material Characterization
Depending on whether or not your chosen material is in the simulation database — and sometimes even if it is — analysts will have some important choices to make and factors to be aware of. Learn them here.


In this three-part series of articles, we are reviewing the components of a successful molding simulation, including the questions to ask and key factors to consider to ensure it is completed correctly from the start. In part one, we discussed modeling accuracy and meshing. Continuing in this series, this article will explore material characterization.
One of the most common challenges is that your specific grade of material might not be available in the database. You are left with the decision to either get the material characterized, or to choose a substitute. If a substitute material is to be used, any rheological differences between the substitute and the actual material will obviously affect the simulation results. On the other hand, if you are fortunate enough to have your desired grade available in the database, is that enough to proceed with confidence? Spoiler alert … it is not.


Material Quality
In order to make accurate predictions, high-quality material data is required. Moldflow helps analysts determine the quality of their material characterization by providing Material Data Completeness Indicators for filling, packing and warpage. These indicators are classified as either bronze, silver or gold. The classification levels are based on the testing method, the quality of data tested (number of data points recorded), and how recently the testing was completed (ratings do expire over time).
When accuracy matters, the analysis should be performed using gold-rated materials.
A gold rating, with its thorough characterization, will give a user fairly high confidence in the results. Bronze ratings may consist of potentially single-point (incomplete) data and/or supplemental data (untested, averaged values). Silver ratings may be a combination of the two, with some tested values but also some supplemental or incomplete data. To be clear, bronze-rated materials can still provide helpful results and help to make design decisions but should not be expected to provide precise values. When accuracy matters, the analysis should be performed using gold-rated materials.
Testing Resources
There are multiple sources for obtaining material characterizations for Moldflow. Autodesk Moldflow Plastics Labs has its own testing lab located in Australia. There are also dedicated material testing labs: Beaumont Advanced Processing (Erie, Pa.) and DatapointLabs (Ithaca, N.Y.). Additionally, material manufacturers often have their own testing capabilities. Naturally, testing capabilities and equipment will vary between these sources. Only Autodesk Moldflow Plastics Labs and its partner Beaumont Advanced Processing have proprietary testing methods such as Injection Molding Rheometer (IMR) for viscosity, and measured shrinkage data (CRIMS), which we will discuss shortly.
Measured Data
Figure 1 shows a screen shot of the material property details that the analyst can view within the software. These material details can start to give an analyst more insight into the quality of the characterization, beyond a simple gold, silver or bronze. The line highlighted shows who tested the data, and then two additional fields: one for pvT data, and one for mechanical properties. Between those two fields, there are two options: measured or supplemental. Measured data means that it was measured for that specific grade of material. Supplemental data are untested values, derived from average values of the material family.
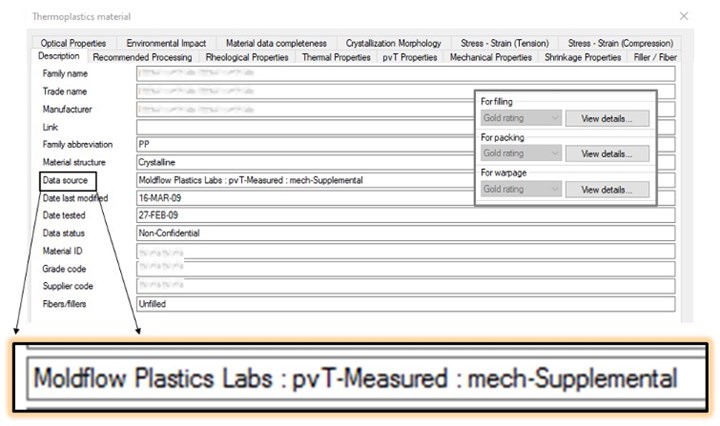
FIG 1 If the material is in the database, users can see additional details about the resin.
(Illustrations: AIM)
In Fig. 1, the pvT data are measured specifically for that exact grade of resin. The mechanical properties are supplemental. In this case, that would be a family averaged value of every unfilled PP in the database. The issue with supplemental values is without truly testing for those mechanical properties, there is no way of knowing how the actual tested values would compare with the family average values.
Multiple Points of Data
In Moldflow, thermal properties, such as thermal conductivity and specific heat, are included in the characterization data. Many bronze-rated materials will only include a single data point, but gold-rated materials will have up to 12 points of data. Figure 2 shows the thermal properties for the same grade of an amorphous material (ABS) with two different characterizations. Note that the bronze material contains single-point data and doesn’t line up with the actual, tested values. Because both properties change over various temperatures, obviously the more points of data we have, the more accurate our results will be.
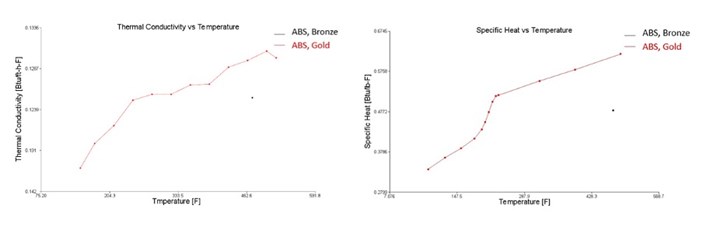
FIG 2 Thermal properties for bronze and gold characterizations.
Shrinkage Data (CRIMS)
To further complicate this already complex subject, the gold rating for warpage is somewhat mesh dependent. To achieve gold, you either need measured shrinkage data (CRIMS) or tested mechanical properties, but it is not required to have both.
CRIMS is an abbreviation for Corrected Residual In-Mold Stress, and it is intended to improve warpage predictions in midplane and Dual-Domain meshes. Trending would be similar with or without this data, but the CRIMS model helps to dial in the magnitude of warpage, thus providing more accurate results.
Currently, Moldflow’s public material database contains almost 12,500 grades of resin, with just over one-third having a gold-rated warpage Material Data Completeness Indicator.
The CRIMS model is generated by molding rectangular plaques at various conditions. These can consist of a range of melt temperatures, mold temperatures, flow rates, packing pressures and a minimum of three different wall thicknesses. The plaques are stored in a climate-controlled room for one week to condition, and then multiple measurements are recorded using an optical scope. All of this real world measured data is used to help build the CRIMS shrinkage model. CRIMS will help improve warpage predictions, but it is exclusive to midplane and Dual-Domain meshes. CRIMS is not used on 3D meshes, as 3D-warpage predictions rely more on the mechanical properties.
Figure 3 shows the shrinkage and mechanical properties of the same material referenced in Fig. 1. It has a gold warpage rating due to the CRIMS data, but uses supplemental mechanical data (indicated in Fig. 1, but also by the red text in Fig. 3). If the analyst was using a midplane or a Dual-Domain mesh, this is a well-characterized material. However, if the analyst was using a 3D mesh, the gold rating is somewhat misleading as the quality of the material data is a bit lacking due to those supplemental mechanical properties. This is where material characterization may drive mesh choices, provided the geometry allows it.
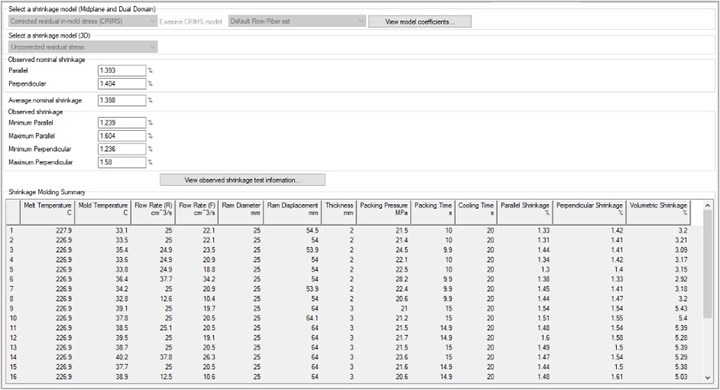
FIG 3 Shrinkage and mechanical properties (inset).
Material Characterization Testing
Figure 4 shows the tests available for material characterization. The characterization codes listed are valid for both Autodesk Moldflow Plastics Labs and Beaumont Advanced Processing, but other resources may have different codes. This variety of test packs allows the user to select the best option for their situation. If the user were only concerned about filling, they could order test MPL-110. If they were to only run 3D analyses, they could order MPL-130 for a full characterization since there would be no need for CRIMS shrinkage data.
CRIMS data are not used in the 3D-warpage predictions but do add to the cost and potential lead time of testing. MPL-150 would be my preferred choice because it covers all the bases for material characterization, as it includes both CRIMS and measured mechanical properties. Therefore, it would provide the most accurate results across all mesh/analysis types.
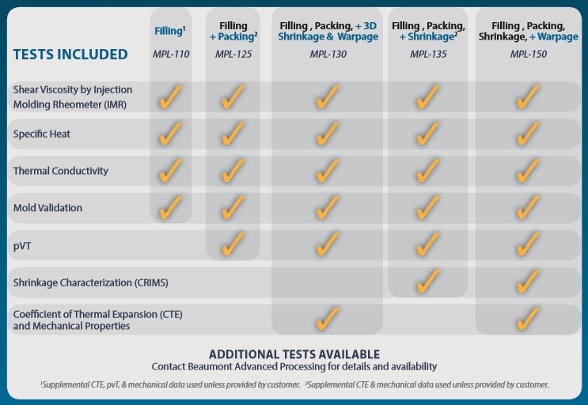
FIG 4 A variety of material-characterization testing options are available.
PC Case Study
Let’s apply these concepts to a real-world example using our eight-cavity mold. In Fig. 5, six different characterizations of the same exact grade of PC are charted. The differences in the material characterizations are testing sources, testing methods and the data completeness indicators. There are both bronze- and gold-characterized materials represented. The mesh type and density are identical, as are the processing conditions. The graph shows the resultant system pressures for what should be the same exact material grade. You can see that depending on the material characterization, the pressure predictions vary greatly.
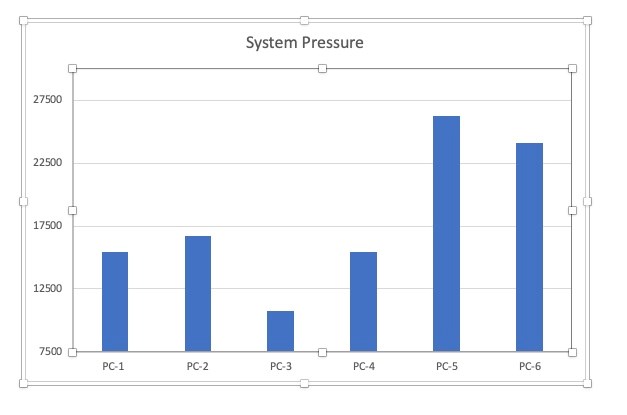
FIG 5 Comparing material characterization’s effect on pressure predictions.
Take a close look at PC-5 and PC-3, or the predicted minimum and maximum pressures. PC-5 results in a pressure of 26,156 psi, while PC-3 results in a pressure of 10,703 psi, or roughly a 15,000-psi pressure difference! PC-5 was a gold-rated material, while PC-3 was a bronze-rated material. PC-5, with its gold rating, should give the analyst more confidence in those results.
In Fig. 6, we are going to take material characterization out of the equation. This example is run with the same material characterization, specifically the PC-5 file (fully characterized, gold rated) and the same processing conditions. The only thing that has changed is the part/runner mesh.
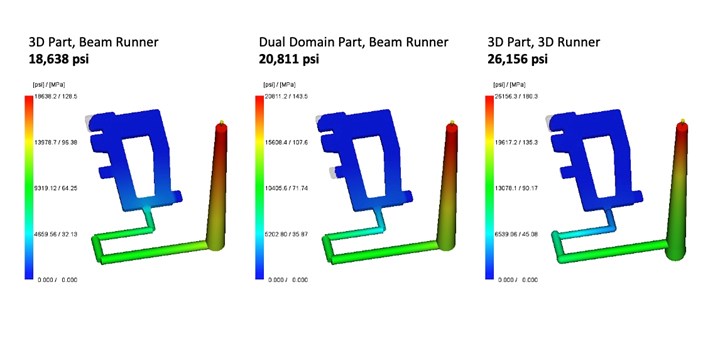
FIG 6 Same material characterization, different part/runner meshes.
Here you can still see about a 7500-psi pressure difference across the three runs, which highlight solver differences between the various mesh types. This example helps to demonstrate what effect the analyst’s choices of material and meshing can have on the final results.
To compare with actual molding, we must first subtract out machine and screw conveyance losses for a fair comparison. After subtracting the air shot, the pressure seen on the molding floor was 27,389 psi. That compares relatively well against the 26,156 psi prediction from simulation, but certainly not against some of the others.
The Devil Is in the Details
Currently, the public material database in Moldflow contains almost 12,500 grades of resin. Of those, just over one-third have a gold-rated warpage Material Data Completeness Indicator. This has improved over the years and will continue to improve as both awareness and testing grow.
How do you know what your analysis was run with? Your Moldflow analyst can and should provide you with these details. They should specify whether the actual material grade was used for the analysis, or if they had to pick a substitute material, and if so, what was substituted. Ideally, the level of characterization should also be communicated, so you know how much confidence to have in the results.
In the last article in this series, we will review the remaining factors: processing inputs, detailed reports and the analyst.
ABOUT THE AUTHOR Jennifer Schmidt is the senior Moldflow instructor at the American Injection Molding (AIM) Institute. She has more than 20 years’ experience in the plastics industry, with a focus on flow simulation. She is a Certified Moldflow Expert and GM-Approved Moldflow Analyst. Schmidt holds a Bachelors’ Degree in Plastics Engineering Technology from Penn State Erie. Contact: 866-344-9694; jschmidt@aim.institute; aim.institute.com


Related Content

How to Reduce Sinks in Injection Molding
Modifications to the common core pin can be a simple solution, but don’t expect all resins to behave the same. Gas assist is also worth a try.
Read More
A Systematic Approach to Process Development
The path to a no-baby-sitting injection molding process is paved with data and can be found by following certain steps.
Read More
Using Data to Pinpoint Cosmetic Defect Causes in Injection Molded Parts
Taking a step back and identifying the root cause of a cosmetic flaw can help molders focus on what corrective actions need to be taken.
Read More
Know Your Options in Injection Machine Nozzles
Improvements in nozzle design in recent years overcome some of the limitations of previous filter, mixing, and shut-off nozzles.
Read MoreRead Next

Scared Straight on Molding Simulation
Molding simulation is such a vital technology today that many molders couldn’t imagine life without it. But as a “consumer” of such a service, you have to know how to carefully critique the simulation results, which can hide a multitude of shortcuts and compromises that threaten their utility.
Read More
Beaumont Tech Buys Material Characterization Business from Autodesk Moldflow
A trainer in mold analysis and supplier of simulation services acquires testing facilities used to obtain materials data needed for accurate simulation.
Read More
How to Achieve Simulation Success, Part 1: Model Accuracy and Mesh Decisions
Molding simulation software is a powerful tool, but what you get out of it depends very much on your initial inputs. Follow these tips to create the most successful simulation possible.
Read More