Improving Molding Process Capability: Understanding the PVT Graph, Part 1
Process capability is related to the variation in part dimensions from shot to shot. High values of process capability require the shrinkage of the material to be identical on each shot, which can be confirmed from the pressure-volume-temperature (PVT) graph.
In part one of this two-part series we will be discussing how to improve the capability of a given molding process. In this installment, we’ll cover Process Capability and the Pressure–Volume–Temperature (PVT) graph.
PRIMER ON PROCESS CAPABILITY
Variation is natural to all processes, and this variation can be measured in the output of the process. For example, one of the outputs of the processes of getting to work is the time it takes to get to work. We can say it takes us 20 minutes, but in reality, it is an average value of the times it has taken us to get to work over the past few days or weeks or years. The actual value on a certain day is therefore anywhere around the 20-minute average and may be, for example, somewhere between 17 and 23 minutes.
There is always a spread of the values from which an average is calculated. In injection molding, if a dimension is measured and reported as an average of 2.175 in., then there will be a spread around the 2.175 in. with a natural variation of, for example, ±0.002 in. The distribution shows one peak and two tails and appears to be fairly normal. In this article we will deal with only normal distributions.
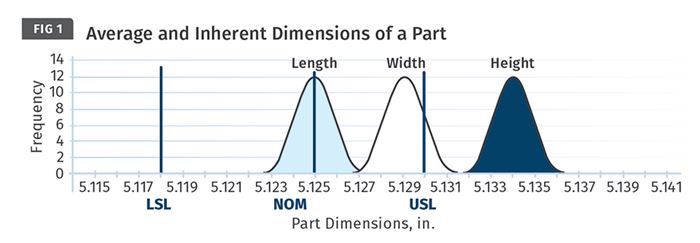
Consider the case of a box that needs to be molded with the length, width and height all with a nominal value of 5.125 in. The allowable tolerances are set at ± 0.006 in. The Lower Specification Limit (LSL) is therefore 5.119 in., and the Upper Specification Limit (USL) is 5.131 in.
A mold trial is undertaken, 30 parts are molded, and the three dimensions of the length, width and height are measured on all 30 parts. The average length measures 5.125 in., the average width measures 5.130 in., and the height averages 5.135 in. Each of the dimensions has a spread of 0.004 in. for the 30 parts measured.
As can be seen from the Fig. 1, the length of the part is within specifications for all the 30 parts, the width of the part is acceptable for some of the 30 parts and the height of the parts is out of specification for all the parts. In each case, the total spread of the variation is 0.004 in. and the total available tolerance is 0.012 in.
There are four terms that are defined based on the spread, the tolerances and the possibility of molding acceptable parts. These are process-capability indices called Pp, Ppk, Cp and Cpk. Pp and Ppk are related to confined smaller sample sizes, such as the one above of 30 parts when an initial trial was performed. These are anecdotal and related to the particular run or experiment. Cp and Cpk are related to the long-term predictive performance of the process.
Pp and Cp are the ability of the process to produce acceptable parts if the average of the parts was centered at nominal. If the variation of 30 parts is less than the available tolerance, and if the average of the 30 parts for all the three dimensions was equal to the nominal value on the drawing, then all the 30 parts would be acceptable for the length, width and the height of the part.
In all the above cases, the variation in the 30 samples is 0.004 in. compared with the available tolerance of 0.012 in. In such a case, the calculated Pp value is high for all the dimensions. A Pp value of 1.33 or more is preferred.
Ppk and Cpk are the ability of the process to produce acceptable parts with the current status of the mold and process. In case of the height of the part, the average is at 5.135 and all the parts are out of specification. In such a case, the Ppk is very low, since although the spread is acceptable, the complete spread is outside of the specification limits and no part is acceptable. A Ppk value of 1.33 or more is preferred. In such cases, a variation-reduction action is not required but process centering will need to be done. Process centering can be achieved by adjusting mold steel dimensions and/or the product specification.
The premise here is that a robust process was developed using the techniques of Scientific Molding and Design of Experiments (DOE). Most books on process control and quality have more information on the topic, including the formulas. Chapter 13 of my book, Robust Process Development and Scientific Molding, also carries this information.
UNDERSTANDING THE PVT RELATIONSHIP
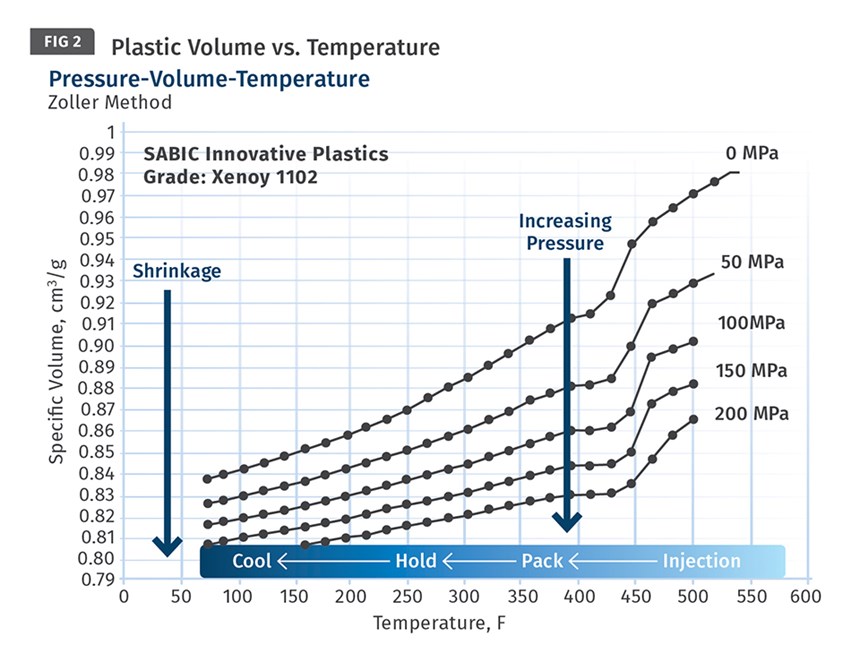
Figure 2 shows a typical PVT diagram. The X-axis represents the melt temperature and the Y-axis represents the specific volume of the material. (Specific volume is the ratio of volume to mass, or cm3/g. It is the inverse of specific gravity, g/cm3.) At 0 MPa of pressure, as the temperature of the plastic is increased, the specific volume increases. At any given temperature, if an external pressure is applied, the melt gets compressed and the specific volume decreases. Specific volume is directly proportional to temperature but is indirectly proportional to pressure.
In injection molding, a combination of these factors is involved as the melt is transformed into the product. The melt is collected as a shot in front of the screw. There is some compression of the melt because of the back pressure during the shot buildup process. The molten plastic is then injected with high pressure into a cold mold. During this process—and after the plastic is inside the mold—the melt is cooling. As the melt is being transformed into the final molded product, the pressure, volume and temperature of the melt are all continuously changing, and the final contour in the PVT graph is a combination of the curves in Fig. 2. Shrinkage is the reduction in volume and is therefore reflected in the PVT diagram.
Shrinkage determines the final dimensions of the part. Process capability is related to the variation in part dimension from shot to shot and therefore in the complete set of parts, such as in a production run. To achieve high values of process capability, the shrinkage of the material must be identical from shot to shot, which in turn mandates that the resultant PVT graph is repeated from shot to shot inside the mold.
In Part 2 we will discuss how each of the five pillars of molding play a role in process capability: part design, plastic material, mold design and moldmaking, molding machinery, and the molding process.
ABOUT THE AUTHOR: Suhas Kulkarni is the founder and president of Fimmtech, San Diego, an injection molding service-oriented firm focusing on Scientific Molding. Fimmtech has developed several custom tools that help molders develop robust processes, and its seminars have trained hundreds of individuals. Kulkarni is an author of the book, Robust Process Development and Scientific Molding, published by Hanser Publications. Contact: (760) 525–9053; suhas@fimmtech.com; fimmtech.com.
Related Content
Online Versions of Process Development Course and Software Launch
NPE2024: FimmTech is introducing online versions of its Nautilus process development software as well as its Scientific Molding and Design of Experiments (DOE) process development course.
Read MoreUse These 7 Parameters to Unravel the Melt Temperature Mystery
Despite its integral role in a stable process and consistent parts, true melt temperature in injection molding can be an enigma. Learning more about these seven parameters may help you solve the puzzle.
Read MoreRead Next
See Recyclers Close the Loop on Trade Show Production Scrap at NPE2024
A collaboration between show organizer PLASTICS, recycler CPR and size reduction experts WEIMA and Conair recovered and recycled all production scrap at NPE2024.
Read MoreMaking the Circular Economy a Reality
Driven by brand owner demands and new worldwide legislation, the entire supply chain is working toward the shift to circularity, with some evidence the circular economy has already begun.
Read MoreLead the Conversation, Change the Conversation
Coverage of single-use plastics can be both misleading and demoralizing. Here are 10 tips for changing the perception of the plastics industry at your company and in your community.
Read More


