MATERIALS: The Problems with Single-Point Data: Part 10
You can predict creep performance of a material over time at a particular temperature by examining how its modulus changes over a range of temperatures.
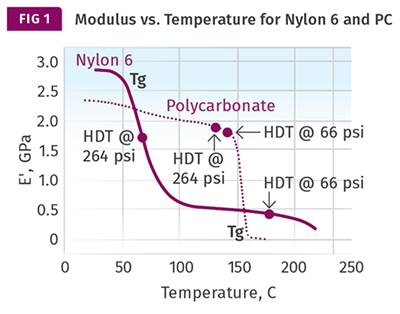
We have discussed very briefly the idea that the effects of temperature and time are equivalent in polymers. The elastic modulus of a material will be reduced by increasing the temperature, and the exact nature of this relationship will depend upon the structure of the polymer. In the same way, applying a constant load to a material at a constant temperature will produce a reduction in the creep modulus or apparent modulus of the material. The path of the reduction in the creep modulus will resemble the behavior observed as a function of temperature.
Simply put, if you have access to data that characterize the temperature-dependent behavior of a material, find your application temperature on the elastic modulus curve and then look at the behavior as the temperature increases from there. The plot will be a good predictor of the time-dependent behavior. A curve that shows little change with increasing temperature will provide good creep resistance, while a material that is about to exhibit a significant loss in stiffness with increasing temperature will display a corresponding significant change in creep modulus as a function of time under load. This does not take the place of a real-time creep test. However, it does allow for some useful comparisons before a great deal of time is devoted to conducting long-term tests.
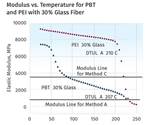
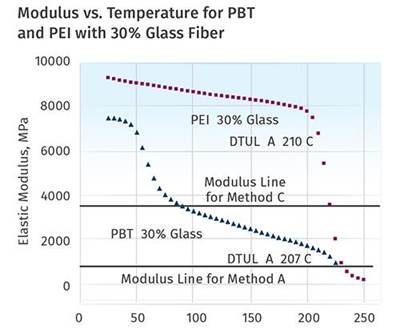
This principle was demonstrated in a case where a client had selected a 30% glass-fiber reinforced PEEK for an application where the product operated at a constant temperature of 140°C (284°F). The client was confident that the material would be appropriate, based on the fact that the deflection temperature under load (DTUL) was greater than 325°C (617°F). However, during testing the material exhibited a significant amount of creep in a relatively short time. It was found that by changing to a polyetherimide (PEI) with the same glass-fiber loading, the creep problem was resolved despite the fact that the DTUL for the PEI was more than 100°C lower. This was puzzling to the client until we produced the plots of elastic modulus as a function of temperature for the two materials and explained their significance.
The graph at left shows the comparison of the two plots. PEEK is a semi-crystalline polymer with a glass-transition temperature (Tg) near 150°C (302°F). As is the case with all polymers, the glass transition is associated with a relatively sudden and substantial change in viscoelastic properties. Specifically, the elastic modulus will decline while the viscous modulus (not shown in these plots) increases. This changes the balance between load-bearing properties and compliance, making the material much more susceptible to creep.
The extent of the rapid decline in apparent modulus is predicted by the degree of change in the temperature-dependent modulus. For this particular grade of PEEK, the decline is approximately 75% from the plateau before the glass transition to the plateau after the glass transition. Knowing this allows us to make a good estimate of how much creep strain the material will exhibit when placed under load at the application temperature of 140°C (284°F).
Note that by the time the temperature reaches 200°C (392°F), this large change is complete and the elastic modulus levels off. This allows us to predict that once the material has undergone this initial stage of creep, it will stabilize for a significant period of time. But for this client the initial creep was too great to manage and a new material had to be found. Since the mold had already been constructed, the ideal solution would be another semi-crystalline polymer with a higher Tg. With a greater difference between the application temperature and the Tg, the onset of significant creep would be extended to a longer time scale.
However, PEEK and related aromatic polyketones represent the upper end of the temperature performance scale for semi-crystalline thermoplastics. To obtain the desired degree of improvement required a polymer with a Tg that exceeded 200°C (392°F). This is still a very high-performance realm, but there are amorphous polymers that can fulfill this requirement and PEI is one of them. With a Tg of 217°C (423°F) and the appropriate glass-fiber content, the material is sufficiently rigid and is more stable over time at the application temperature, solving this particular application problem.
This does not mean that PEI is inherently superior to PEEK. The creep response of a particular polymer depends upon the application temperature relative to key transition temperatures. If the application temperature were lower, 100°C for example, the influence of the glass transition on the time-dependent performance of PEEK would represent a much smaller consideration. By the same token, if the application temperature were 200°C (392°F), the PEI would be susceptible to significant creep for the same reason that the PEEK was not a good selection for 140°C. However, the PEEK, having already gone through its glass transition, would be on a stable plateau that is associated with a good creep resistance, albeit at a lower modulus. The design engineer would need to account for this lower set of properties in the design of the part, but creep would not be an issue for PEEK at this temperature.
The difference in structure between the two materials is very important in assessing the probable outcome of long-term, constant loading. PEI is amorphous and consequently, when it passes through its glass transition, the loss in elastic modulus is greater than 99%. Remember that this decline in elastic modulus is predictive of the change in creep modulus over time and that strain is inversely related to creep modulus, as shown in the equation:
Ea = σt/(εo + εc)
where Ea is the apparent or creep modulus, σt is the constant stress applied over time, εo is the initial strain governed by the modulus of the material, and εc is the creep strain that increases over time for as long as the stress is applied.
The PEEK material undergoes a 75% reduction in modulus as it passes through the glass transition. If this modulus reduction is applied to the apparent modulus in the equation above, this can be equated to a four-fold increase in the strain, if we assume linear behavior. While this represents significant deformation, it may be managed if the applied stress results in a relatively small initial strain. For example, an initial strain of 0.2% may increase only to 0.8% at a point in time that would need to be determined by testing.
However, consider an amorphous polymer that undergoes a 99% reduction in elastic modulus as it passes through its glass transition. This is again a predictor of creep performance. An amorphous polymer that is used at a temperature on the threshold of the glass transition, will undergo rapid deformation that corresponds to a similar reduction in apparent modulus. In such a case, the increase is 100 times greater than the initial strain. Therefore, a 0.2% initial strain becomes a 20% strain very quickly. Even if we assume linear behavior, which will not be the case at such high strains, we know that any glass-filled material will rupture well before it reaches 20% strain.
It just so happens that the DTUL for amorphous polymers is in exactly the temperature region we just described, on the verge of going through the glass transition. This is the reason that using an amorphous polymer under load at the deflection temperature under load is possible only for very short time frames.
ABOUT THE AUTHOR
Mike Sepe is an independent, global materials and processing consultant whose company, Michael P. Sepe, LLC, is based in Sedona, Ariz. He has more than 35 years of experience in the plastics industry and assists clients with material selection, designing for manufacturability, process optimization, troubleshooting, and failure analysis. Contact: (928) 203-0408 • mike@thematerialanalyst.com.
Editor’s note: You can read the next part in the series by clicking here.
Related Content
Injection Molding: Focus on these Seven Areas to Set a Preventive Maintenance Schedule
Performing fundamental maintenance inspections frequently assures press longevity and process stability. Here’s a checklist to help you stay on top of seven key systems.
Read MoreBack to Basics on Mold Venting (Part 1)
Here’s what you need to know to improve the quality of your parts and to protect your molds.
Read MoreImproving Twin-Screw Compounding of Reinforced Polyolefins
Compounders face a number of processing challenges when incorporating a high loading of low-bulk-density mineral filler into polyolefins. Here are some possible solutions.
Read MoreA Systematic Approach to Process Development
The path to a no-baby-sitting injection molding process is paved with data and can be found by following certain steps.
Read MoreRead Next
MATERIALS: The Problems with Single-Point Data, Part 7
The industry can choose between continuing to perform DTUL tests that provide single points that are part of a curve never seen, or perform the test that provides the entire curve.
Read MoreMATERIALS: The Problems with Single-Point Data, Part 8
DTUL tests may have made sense in the 1940s and 1950s, before the advent of dynamic mechanical analysis. But designers and engineers today need better tools.
Read MoreMATERIALS: The Problems with Single-Point Data: Part 9
Time—and not just temperature—governs the behavior of materials under load. Both must be considered when evaluating a polymer for an application.
Read More
.jpg;width=70;height=70;mode=crop)
