Melt Flow Rate Testing—Part 3
There is a well-established relationship between something called the weight-average molecular weight of a polymer and a parameter known as the zero-shear viscosity.
A couple of years ago I received an indignant e-mail from a gentleman challenging my statement that melt flow rate measurements usually provide a good assessment of the relative average molecular weight of a polymer. How, he demanded, do you convert a flow-rate measurement expressed in units of grams/10 minutes, to a measurement of molecular weight, which is given in grams/mole? Researchers have addressed this question.
There is a well-established relationship between something called the weight-average molecular weight of a polymer and a parameter known as the zero-shear viscosity. While the exact relationship is somewhat dependent upon the polymer, the general equation that can be found in the literature is:
ho = kMw3.4
where ho is the zero shear viscosity, Mw is the weight-average molecular weight, and k is a constant that is specific to the polymer being evaluated. The exponent 3.4 does not apply universally; however, the values do tend to fall in a range between 3.2 and 3.9. In any event, this relationship clearly shows that relatively modest changes in molecular weight (MW) result in large changes in melt viscosity when this viscosity is measured at a very low shear rate.
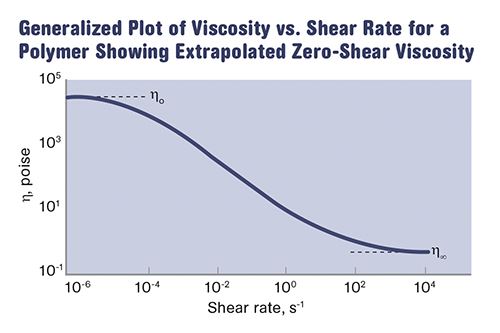
Zero shear rate is a concept only a mathematician could love. In practice you cannot measure viscosity at a shear rate of zero because viscosity is a measurement of resistance to flow. So to measure resistance to flow you have to make the polymer flow, and as soon as you do so the shear rate becomes some non-zero value. But logarithmic plots of viscosity versus shear rate tend to level off as the shear rate approaches zero, so we can extrapolate the curve back to the y-axis to arrive at the value for zero-shear viscosity (see Fig. 1).
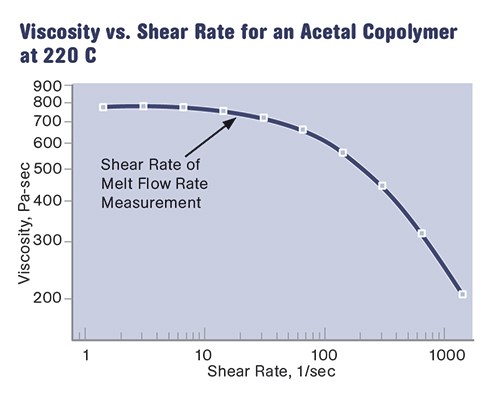
Figure 2 shows an actual viscosity/shear rate curve for a commercial acetal copolymer with a nominal melt flow rate (MFR) of 9 g/10 min. The measurements cover shear rates from 1.4 to 1400 sec-1 and illustrate the early portion of the behavior shown in Fig. 1. The viscosity does not change by a statistically significant amount at shear rates between 1.4 and 7 sec-1 before entering what is referred to as the non-Newtonian region of the curve. Figure 2 also pinpoints the shear rate at which the MFR test is performed on this material, about 20 sec-1. It can be seen that the MFR test is performed at a point very close to the plateau leading back to the zero-shear point on the curve.
This illustrates the usefulness of the MFR test in providing a relative measurement of the average MW of a polymer. Because the MFR test is performed at relatively low shear rates, the results approximate the zero-shear viscosity, despite the fact that the shear rate is not controlled. The fact that the shear rate is not controlled in an MFR test means that the test actually exaggerates the real differences in melt viscosity that occur as a function of molecular weight.
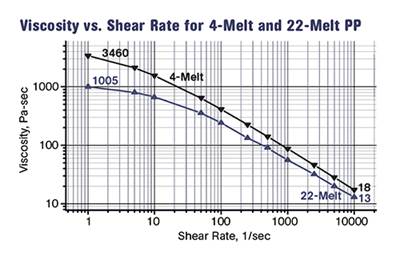
This can be shown by revisiting the viscosity vs. shear rate curves for the two polypropylenes shown in last month’s column. The MFRs for the two materials are often interpreted as indicating that the viscosity of the 4-MFR material is 5.5 times greater than that of the 22-MFR resin.
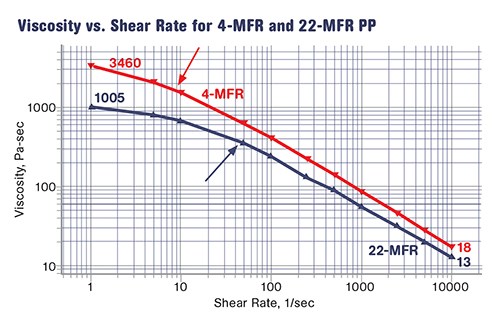
However, if we compare the viscosity of these two materials at any specific shear rate we can see that this is not the case. The largest difference in viscosity between the two materials is observed at the lowest shear rate, and even at this point the ratio of the two viscosities is not quite 3.5:1 (3460/1005=3.44).
Note that as the shear rate becomes higher, the difference in viscosity between the two materials decreases. At the highest shear rate on the graph of 10,000 sec-1 the ratio has declined to 18/13 or 1.38:1. The faster the materials flow the more similar their viscosities appear to be. This is caused by orientation of the long polymer chain, a phenomenon often referred to as shear thinning. This behavior allows processors to move polymer melts long distances through relatively restrictive flow paths, particularly in injection molding.
The reason that the MFR values suggest a larger difference than the viscosity measurements indicate is because the shear rate for the two MFR tests is not the same. The arrows in Fig. 3 show the shear rates at which the MFR tests are conducted for the two materials. As mentioned before, these shear rates are not controlled, they are a result of the rate at which the two materials flow under a constant load. But because the shear rate for the test performed on the 22-MFR material is significantly higher than that used for the 4-MFR material, the differences in viscosity are exaggerated. This is an admitted imperfection of the MFR test. However, it also illustrates well the principle that differences in viscosity caused by variations in MW are most effectively measured at low shear rates. As the shear rates get higher, materials with substantially different MW start to look very similar.
At the extremes, commercial raw materials can be found with MFR as low as 0.1 g/10 min and as high as 500 g/10 min. However, for the vast majority of commercial compounds where an MFR is published, the values fall between 1 and 50 g/10 min. This means that the shear rates of MFR tests typically fall between 2.2 and 110 sec-1.
The exaggerated differences in melt viscosity that the MFR test produces have an unfortunate effect on the processing community, particularly those processors involved with injection molding. Processors tend to think of the MFR values as being representative of the real differences in the flow of the materials.
When molded parts fail to perform as expected, one of the changes that can be made to improve performance is to increase the MW of the polymer being used to produce the parts. This involves changing to a lower MFR material. Often this change is dismissed out of hand by the processor because of the anticipated increase in processing difficulty suggested by the difference in the MFR values. The viscosity curves show that the real differences in viscosity are not as large as suggested by the MFR values.
But it is difficult to get people to think beyond the MFR numbers. Many performance problems that could have been solved with higher-MW materials have instead been approached with complicated changes in part design and process conditions simply because the MFR numbers looked too intimidating.
Next month we will explore the reasons for the perception of MFR as a barrier to processing and explain why processes that exhibit sensitivity to lot-to-lot fluctuations in MFR have fundamental problems related to the molding machine or the way the process is set up.
Related Content
Advanced Biobased Materials Company PlantSwitch Gets Support for Commercialization
With participation from venture investment firm NexPoint Capital, PlantSwitch closes it $8M bridge financing round.
Read MoreHow to Optimize Injection Molding of PHA and PHA/PLA Blends
Here are processing guidelines aimed at both getting the PHA resin into the process without degrading it, and reducing residence time at melt temperatures.
Read MorePart 3: The World of Molding Thermosets
Thermosets were the prevalent material in the early history of plastics, but were soon overtaken by thermoplastics in injection molding applications.
Read MoreThe Effects of Stress on Polymers
Previously we have discussed the effects of temperature and time on the long-term behavior of polymers. Now let's take a look at stress.
Read MoreRead Next
Melt Flow Rate Testing–Part 1
Though often criticized, MFR is a very good gauge of the relative average molecular weight of the polymer. Since molecular weight (MW) is the driving force behind performance in polymers, it turns out to be a very useful number.
Read MoreMelt Flow Rate Testing – Part 2
To fully appreciate the strengths and weaknesses of the melt-flow-rate (MFR) test it is important to know something about the way the test is performed.
Read MoreLead the Conversation, Change the Conversation
Coverage of single-use plastics can be both misleading and demoralizing. Here are 10 tips for changing the perception of the plastics industry at your company and in your community.
Read More
.jpg;width=70;height=70;mode=crop)
